The EUR/USD is building a correction with lower highs and higher lows. Price action seems to be in a bearish ABC pattern within a bullish wave B. What are the key levels to consider?
Price Charts and Technical Analysis
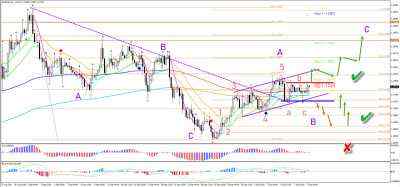
The EUR/USD support (blue line) and resistance (red line) levels are key for determining the next price swing. A bullish breakout above the resistance indicates a completed bearish ABC (red) within wave B (purple) and a continuation higher within the wave C (purple). The targets are the Fibonacci levels although the main Fib target is confluence of the -61.8% Fib and 78.6% Fib at 1.1925. A bearish breakout indicates a downside move towards the Fibonacci retracement levels of wave B (purple). This remains valid as long as price remains above the 100% Fibonacci level.The EUR/USD 1 hour chart is showing the current indecisiveness well. A bullish breakout above the resistance (red box) confirms a completed ABC (red). But a bearish breakout below the support (blue box) indicates that the waves B and C will shift forward (red arrows). The bulls are expected to keep control, either after the breakout or after a bounce at the Fibonacci retracement levels.

Reprinted from Fxempire,the copyright all reserved by the original author.
风险提示:以上内容仅代表作者或嘉宾的观点,不代表 FOLLOWME 的任何观点及立场,且不代表 FOLLOWME 同意其说法或描述,也不构成任何投资建议。对于访问者根据 FOLLOWME 社区提供的信息所做出的一切行为,除非另有明确的书面承诺文件,否则本社区不承担任何形式的责任。
FOLLOWME 交易社区网址: followme.asia


加载失败()