· 阅读量 265
We used the theory of price action in order to conduct this analysis, so that we could guide our decision-making process.
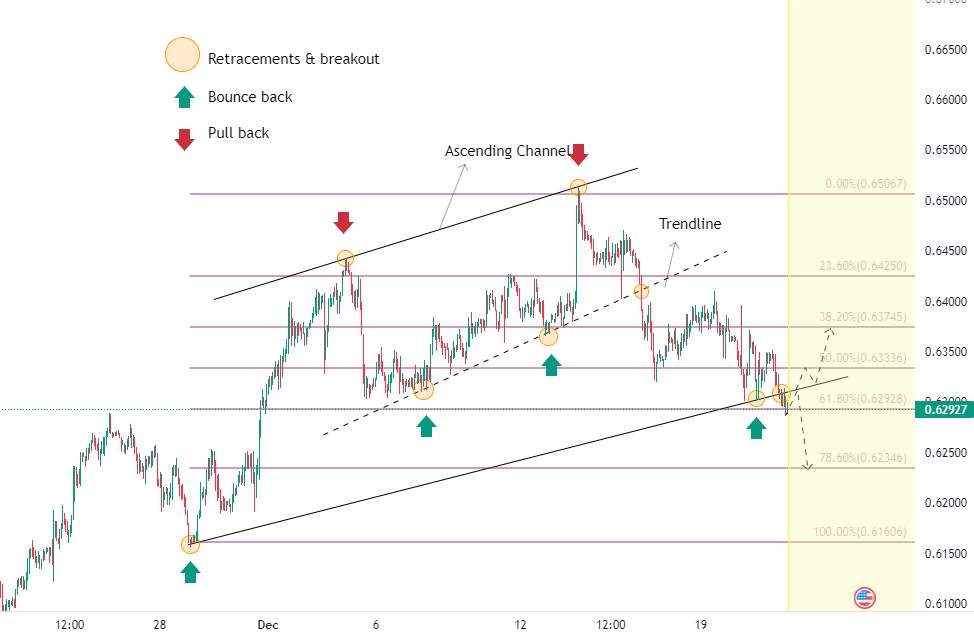
Based on the results of this analysis, we can see that the price is moving upwards while using the ascending channel to do so. In the past several months, the price has given us numerous pullbacks and bounce backs. In addition, the price has also tested the inner trend line in an attempt to complete the uptrend. However, near 0.64096, the price finally broke the inner trend line , giving us a short-term retracement, which gave us a new short-term downtrend. For more accuracy, we use Fibonacci levels. As of today, the price has already broken through the ascending channel and has held the support level of 0.62928 (61.80% of the Fibo). In the following days, we will be able to target the area where we can trade.
1.In the case of a price support moving down, the price is likely to move down and test the next support near 0.62928. If this support is broken, the price will enter a trend.
2.The target area near 0.63336 and 0.63745 is a retracement from the support area and a retest of the channel line; then price closes within the channel.
With this analysis, you will be able to find your most profitable trade, since Enclavefx believes in enhancing the knowledge of our clients & followers.
风险提示:以上内容仅代表作者或嘉宾的观点,不代表 FOLLOWME 的任何观点及立场,且不代表 FOLLOWME 同意其说法或描述,也不构成任何投资建议。对于访问者根据 FOLLOWME 社区提供的信息所做出的一切行为,除非另有明确的书面承诺文件,否则本社区不承担任何形式的责任。
FOLLOWME 交易社区网址: followme.asia
喜欢的话,赞赏支持一下


加载失败()