*Previous Trading Session*
• On Tuesday, Gold price extended its daily uptrend and rose to a fresh multi-week high above $2,060.
• The benchmark 10-year US Treasury bond yield stays in negative territory below 3.9% after soft US PCE inflation data, allowing XAU/USD to gather bullish momentum.
*Current Situation*
• The gold has shown a strong bullish momentum during Tuesday’s early Asian Session, despite the steady US dollar.
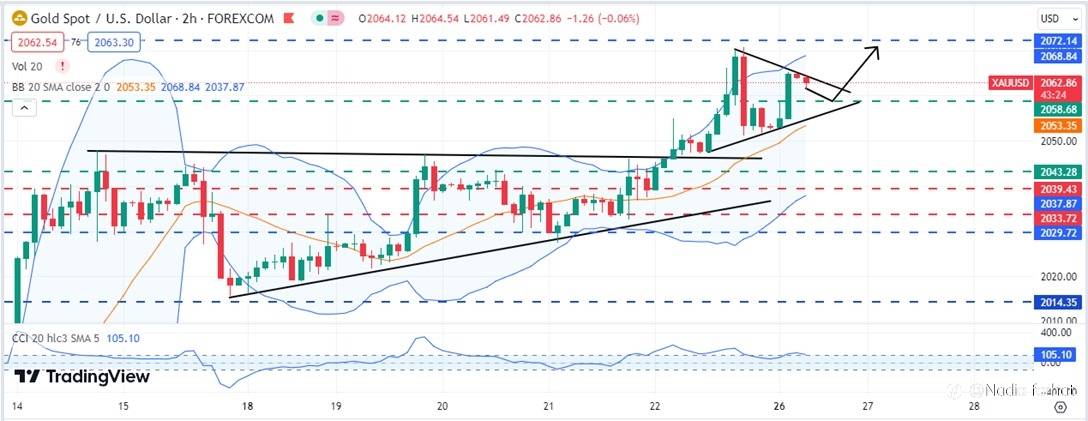
• Gold extended the previous week’s strength and it retested the upper trend line of the symmetrical triangle pattern as the day began on Tuesday post-Christmas Holiday.
• Gold currently consolidating at the upper trend line of the triangle pattern – signaling further bullishness. However, it is crucial for gold to give a higher breakout out of the triangle to test higher resistance levels.
• Currently XAU/USD is hovering near 2064.88
*Analysis*
• The gold seems to be driven by the weakness in US dollar.
• The 10-year U.S. Treasury yield on Wednesday hit its lowest level since July. The yield on the benchmark 10-year Treasury note fell 7 basis points to 3.849%. On July 27, the 10-year yielded as low as 3.839%.
• Further, Sticky inflation in Euro Zone raise probabilities of further rate hikes, which has negatively impact dollar prices.
• Safe-haven demand for gold increased amid a significant selloff in equities, and due to the escalation of terrorist activities in Red Sea – a major maritime trade route.
*Technical Indicators:*
• Gold continues to trend in the bullish zone as per technical indicators.
• Gold on Tuesday hovers above the middle band of the Bollinger Band as visible on the attached H4 chart.
• The CCI levels also lies above the 0.0 level near 112 levels.
• As per the technical indicators, the prices are expected to take a minor correction before resuming its bullish trajectory.
*Important Levels to Watch*
• Resistance: A bullish acceptance above the symmetrical triangle pattern, intraday highs of 2065.15 will drag prices till the 2095 level. Above which, gold price to resume its journey higher toward a new all-time high level.
• Support: To begin a declining trend, it is important that gold gives a daily closing below 2058.68. Below the correction mode will begin with the next support at 2043.29.
#XAU/USD# #gold# #GOLDTODAY# #ChinaGold# #ForexForecast# #Todayanalysis# #analysis# #technicalanalysis# #fundamentalsanalysis# #AnalisisFundamental# #trading# #forextrading# #BeginnerTrader# #NewTraders#
风险提示:以上内容仅代表作者或嘉宾的观点,不代表 FOLLOWME 的任何观点及立场,且不代表 FOLLOWME 同意其说法或描述,也不构成任何投资建议。对于访问者根据 FOLLOWME 社区提供的信息所做出的一切行为,除非另有明确的书面承诺文件,否则本社区不承担任何形式的责任。
FOLLOWME 交易社区网址: followme.asia


加载失败()