• The dollar index has been accumulating substantial bullish strength in the past 3 trading sessions.
• In the previous trading session, the index made highs of 102.21 after it gave a bullish breakout above the ascending wedge pattern and above the immediate resistance at 101.67.
• However, the index looks steady on Wednesday near the 102.15 level.
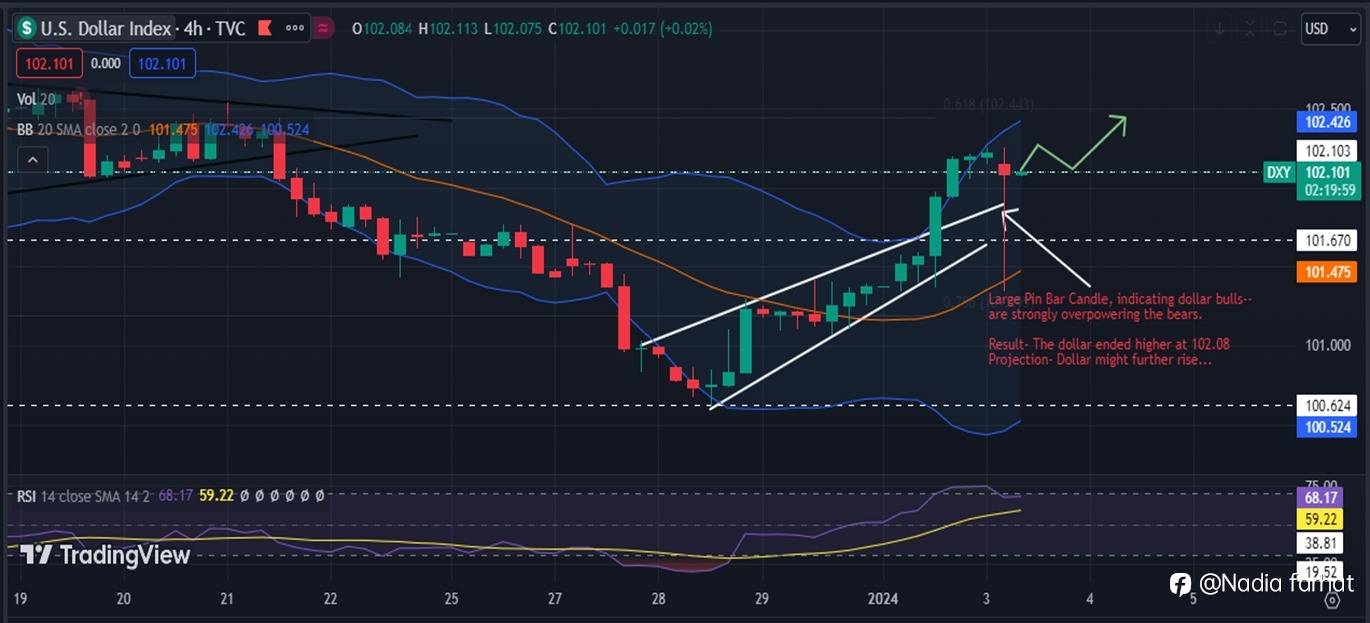
• Although volatility remains high in the index as we can see a large pin bar candle on the 4H chart, making lows of whooping 101.34, but the candle closed higher at 102.08.
• It signals that dollar bulls are strongly overpowering the bears.
*Economic Events*
• On Tuesday, important *S&P Global US Manufacturing PMI (Dec)* rose lower by 47.9 as compared to previous 49.4. It is likely to note that a reading below 50 indicates a contraction in the sector.
• *US Treasury Yield rose – gave a boost to US dollar*: Yields on the rate-sensitive two-year Treasury rose 0.07 percentage points to 4.32 percent, while the yield on the 10-year
*Current Situation:* On Wednesday, the US dollar index remains steady, staying above the 102 mark after a notable 0.8% increase in the preceding session.
*Technical Analysis*
• The index is moving above the middle band of the Bollinger band. Prices are also trending in the buying zone of the RSI indicator.
• Both indicators are indicating bullishness.
*Important Levels to Watch:*
• Support: 102.0 and 101.67 will be important support levels
• Resistance: 102.25 – the intraday highs will act as important resistance, above which levels could reach 102.45
To get such analysis on a daily basis. DM me
风险提示:以上内容仅代表作者或嘉宾的观点,不代表 FOLLOWME 的任何观点及立场,且不代表 FOLLOWME 同意其说法或描述,也不构成任何投资建议。对于访问者根据 FOLLOWME 社区提供的信息所做出的一切行为,除非另有明确的书面承诺文件,否则本社区不承担任何形式的责任。
FOLLOWME 交易社区网址: followme.asia


加载失败()