As a professional trader, technical indicators play a crucial role in helping traders analyze market dynamics, identify trading opportunities, and manage risk effectively. By incorporating technical analysis into their trading strategies, traders can improve their chances of success in the financial markets.
作为专业的交易者,技术指标在帮助交易者分析市场动态、识别交易机会和有效管理风险方面发挥着至关重要的作用。通过将技术分析纳入他们的交易策略,交易者可以提高他们在金融市场上取得成功的机会。
Here are some of the most important candlestick indicators that any trader should know:
以下是任何交易者都应该知道的4项K线图分析指标:
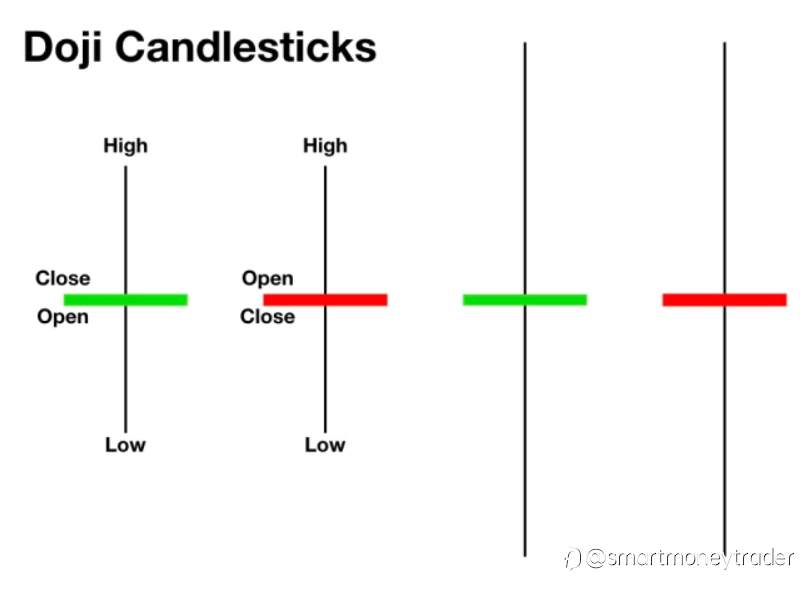
Doji: A Doji candlestick pattern forms when the opening and closing prices are very close to each other, resulting in a very small body. It indicates indecision in the market, where neither buyers nor sellers are in control. A Doji often appears at potential reversal points in the market, signaling a possible change in trend direction.
Doji: 十字星,当开盘价和收盘价非常接近,形成一个非常小的实体时,就会形成十字星蜡烛图案。它表示市场中存在犹豫不决,买卖双方都没有控制权。十字星经常出现在市场潜在的反转点上,暗示可能会出现趋势方向的改变。
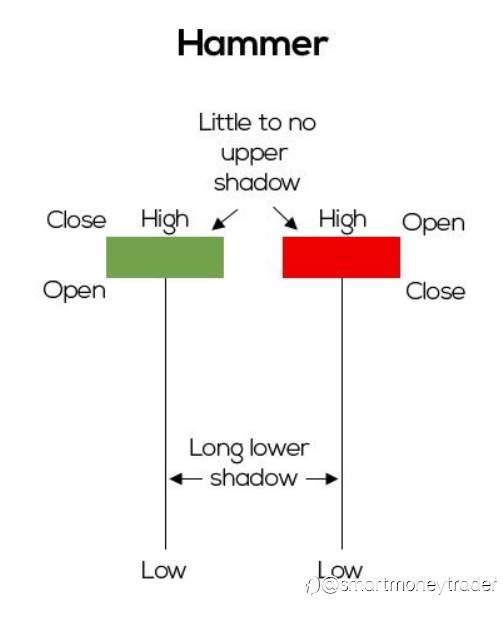
Hammer: A Hammer candlestick pattern occurs at the bottom of a downtrend and signals a potential reversal to the upside. It has a small body near the top of the candlestick and a long lower shadow, resembling a hammer. The long lower shadow indicates that sellers pushed the price lower during the session, but buyers managed to push the price back up by the close, suggesting bullish strength.
Hammer: 锤子,锤子蜡烛图案出现在下跌趋势底部,预示着可能发生向上的反转。它的实体接近蜡烛顶部,下影线较长,形似一把锤子。长下影线表明在交易期间卖方推低了价格,但买方成功在收盘时将价格推高,显示出牛市力量。
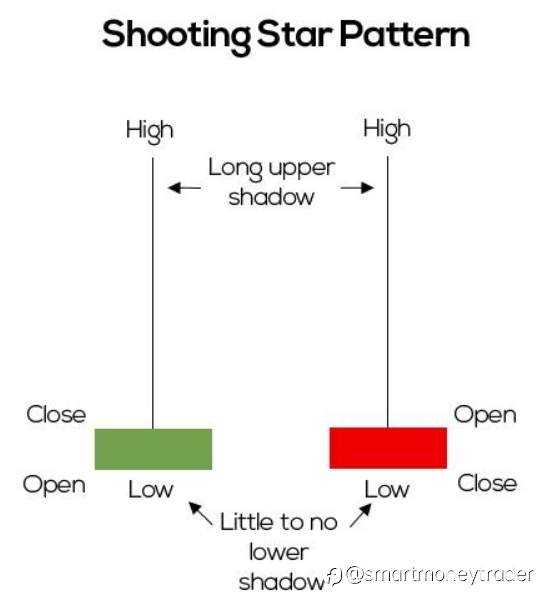
Shooting Star: The Shooting Star candlestick pattern appears at the top of an uptrend and signals a potential reversal to the downside. It has a small body near the bottom of the candlestick and a long upper shadow, resembling a shooting star. The long upper shadow indicates that buyers pushed the price higher during the session, but sellers managed to push the price back down by the close, suggesting bearish pressure.
Shooting Star: 射击之星,射击之星蜡烛图案出现在上升趋势顶部,预示可能会发生向下的反转。它的实体接近蜡烛底部,上影线较长,形似一颗射击之星。长上影线表明在交易期间买方将价格推高,但卖方成功在收盘时将价格推低,显示出熊市压力。
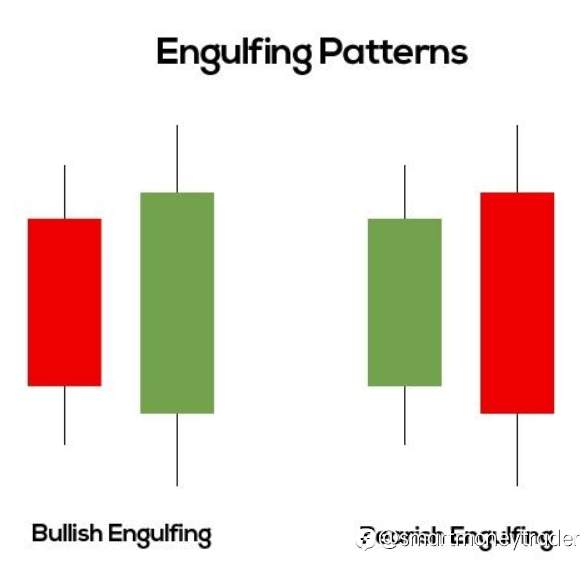
Engulfing Pattern: The Engulfing Pattern consists of two candlesticks and signals a reversal in the market. In a bullish engulfing pattern, the first candle has a small body, followed by a second candle with a larger body that completely engulfs the body of the first candle. This indicates that buyers have overwhelmed sellers, potentially leading to a bullish reversal. Conversely, in a bearish engulfing pattern, the first candle has a small body, followed by a second candle with a larger body that completely engulfs the body of the first candle. This suggests that sellers have overwhelmed buyers, potentially leading to a bearish reversal.
Engulfing Pattern: 吞没形态,吞没形态由两个蜡烛图组成,预示着市场的反转。在牛市吞没形态中,第一个蜡烛的实体较小,紧随其后的第二个蜡烛的实体较大,完全吞没了第一个蜡烛的实体。这表明买方压倒了卖方,可能导致牛市反转。相反,在熊市吞没形态中,第一个蜡烛的实体较小,紧随其后的第二个蜡烛的实体较大,完全吞没了第一个蜡烛的实体。这表明卖方压倒了买方,可能导致熊市反转。
风险提示:以上内容仅代表作者或嘉宾的观点,不代表 FOLLOWME 的任何观点及立场,且不代表 FOLLOWME 同意其说法或描述,也不构成任何投资建议。对于访问者根据 FOLLOWME 社区提供的信息所做出的一切行为,除非另有明确的书面承诺文件,否则本社区不承担任何形式的责任。
FOLLOWME 交易社区网址: followme.asia


加载失败()