
| Scenario | |
|---|---|
| Timeframe | Weekly |
| Recommendation | SELL STOP |
| Entry Point | 151.55 |
| Take Profit | 150.00, 148.43, 146.87 |
| Stop Loss | 152.70 |
| Key Levels | 146.87, 148.43, 150.00, 151.56, 156.25, 159.37, 160.93 |
| Alternative scenario | |
|---|---|
| Recommendation | BUY STOP |
| Entry Point | 156.25 |
| Take Profit | 159.37, 160.93 |
| Stop Loss | 155.20 |
| Key Levels | 146.87, 148.43, 150.00, 151.56, 156.25, 159.37, 160.93 |
Current trend
The USD/JPY pair has been falling for the third week amid the difference in monetary approaches of the US Fed and the Bank of Japan, trading at 152.00.
The probability of further tightening of monetary policy by the Japanese regulator is increasing. The preliminary July data recorded an increase in business activity, which signals the recovery of the national economy. The consumer price index remains above the target level, reaching 2.8% in June, while the core indicator consolidated around 2.6%. So, officials hope to maintain it at high levels thanks to a significant wage increase. According to Reuters, Bank of Japan officials will discuss the possibility of raising the interest rate at a meeting on July 31 but not move to active actions until the fall.
The US Fed experts may turn to “dovish” rhetoric in September, which puts pressure on the dollar. Currently, inflation is slowing growth, business activity is declining, and the labor market is showing signs of cooling. On Friday, investors are expecting the publication of the US June personal consumption expenditure price index. If the indicator meets the forecasts for a reduction from 2.6% to 2.5% YoY, a decrease in the cost of borrowing will become inevitable, although traders already estimate it at about 80.0%.
Most likely, monetary factors will continue to affect the USD/JPY pair negatively soon.
Support and resistance
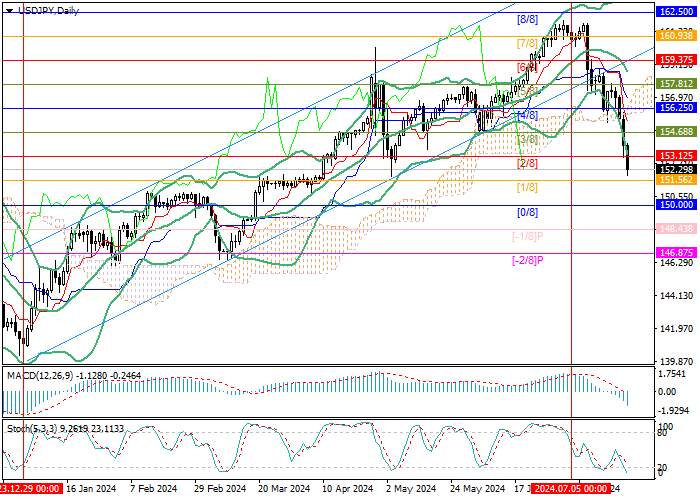
The trading instrument has left the long-term ascending channel and is approaching 151.56 (Murrey level [1/8]). After a breakdown, a decline to the area of 150.00 (Murray level [0/8]), 148.43 (Murray level [–1/8]), and 146.87 (Murray level [–2/8]) may follow. In case of consolidation above 156.25 (Murrey level [4/8]), the resumption of growth to the area of 159.37 (Murrey level [6/8]), 160.93 (Murrey level [7/8]) is likely.
Technical indicators allow the development of a decline: Bollinger bands and Stochastic are directed downwards, although the latter has entered the oversold zone, and the MACD histogram is increasing in the negative zone.
Resistance levels: 156.25, 159.37, 160.93.
Support levels: 151.56, 150.00, 148.43, 146.87.
Trading tips
Short positions may be opened below 151.56, with the targets at 150.00, 148.43, 146.87 and stop loss 152.70. Implementation period: 5–7 days.
Long positions may be opened above 156.25, with the targets at 159.37, 160.93, and stop loss 155.20.
风险提示:以上内容仅代表作者或嘉宾的观点,不代表 FOLLOWME 的任何观点及立场,且不代表 FOLLOWME 同意其说法或描述,也不构成任何投资建议。对于访问者根据 FOLLOWME 社区提供的信息所做出的一切行为,除非另有明确的书面承诺文件,否则本社区不承担任何形式的责任。
FOLLOWME 交易社区网址: followme.asia


加载失败()