| Scenario | |
|---|---|
| Timeframe | Weekly |
| Recommendation | SELL STOP |
| Entry Point | 0.5870 |
| Take Profit | 0.5770, 0.5560 |
| Stop Loss | 0.5950 |
| Key Levels | 0.5560, 0.5770, 0.5875, 0.5910, 0.6000, 0.6135 |
| Alternative scenario | |
|---|---|
| Recommendation | BUY STOP |
| Entry Point | 0.5910 |
| Take Profit | 0.6000, 0.6135 |
| Stop Loss | 0.5860 |
| Key Levels | 0.5560, 0.5770, 0.5875, 0.5910, 0.6000, 0.6135 |
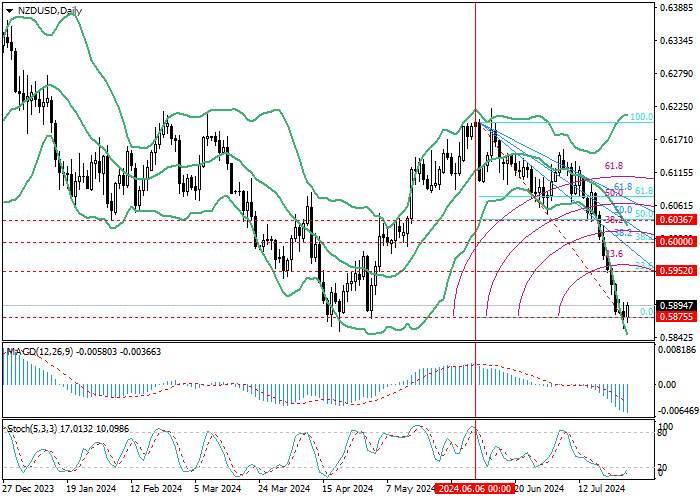
NZD/USD, D1
This week, the price reached 0.5875 (0.0% retracement), from which it is trying to start an upward correction to the levels of 0.5952 (23.6% retracement) and 0.6000 (38.2% retracement). The key for the "bears" remains the 0.5875 mark, consolidating below which will allow quotes to resume their decline in the medium term.
Technical indicators do not give a clear signal: Bollinger Bands are pointing downwards, MACD is increasing in the negative zone, confirming the continuation of the downtrend, but Stochastic is reversing up in the oversold zone, which doesn't exclude the development of a correction.

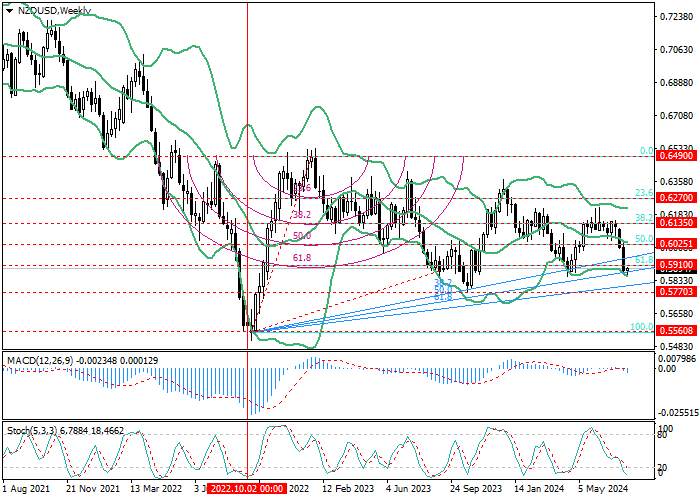
NZD/USD, W1
On the W1 chart, the price reversed around the 0.6135 mark (38.2% retracement) and dropped below 0.5910 (61.8% retracement), trying to break through the counter upward fan. If successful, the decline of the trading instrument may continue down to the level of 0.5560 (100.0% retracement), and the reverse breakout will act as a catalyst for strengthening the upward dynamics to the area of 0.6025 (50.0% retracement, the central line of Bollinger Bands) and 0.6135 (38.2% retracement).
Technical indicators confirm the probability of continuation of the current trend: Bollinger Bands are reversing down, MACD has moved into the negative zone, while Stochastic is directed down, but enters the oversold zone.
Support and resistance
In the near future, the continuation of the decline in the quotes of the NZD/USD pair seems to be the most likely scenario: if the level of 0.5875 (0.0% retracement, D1) is broken down, its targets will be 0.5770 (minimum of October 2023) and 0.5560 (100.0% retracement, W1). If consolidated above the level of 0.5910 (61.8% retracement, W1), the movement will continue to the area of 0.6000 (38.2% retracement, D1) and 0.6135 (38.2% retracement, W1).
Resistance levels: 0.5910, 0.6000, 0.6135.
Support levels: 0.5875, 0.5770, 0.5560.
Trading tips
Short positions can be opened below 0.5875 with targets of 0.5770, 0.5560 and stop-loss around 0.5950. Implementation period: 5–7 days.
Long positions can be opened from the 0.5910 mark with targets of 0.6000, 0.6135 and stop-loss around 0.5860.
风险提示:以上内容仅代表作者或嘉宾的观点,不代表 FOLLOWME 的任何观点及立场,且不代表 FOLLOWME 同意其说法或描述,也不构成任何投资建议。对于访问者根据 FOLLOWME 社区提供的信息所做出的一切行为,除非另有明确的书面承诺文件,否则本社区不承担任何形式的责任。
FOLLOWME 交易社区网址: followme.asia


加载失败()