| Scenario | |
|---|---|
| Timeframe | Weekly |
| Recommendation | SELL STOP |
| Entry Point | 39.80 |
| Take Profit | 39.06, 38.28 |
| Stop Loss | 40.40 |
| Key Levels | 38.28, 39.06, 39.84, 40.62, 41.41, 42.19, 42.97 |
| Alternative scenario | |
|---|---|
| Recommendation | BUY STOP |
| Entry Point | 40.65 |
| Take Profit | 41.41, 42.19, 42.97 |
| Stop Loss | 40.10 |
| Key Levels | 38.28, 39.06, 39.84, 40.62, 41.41, 42.19, 42.97 |
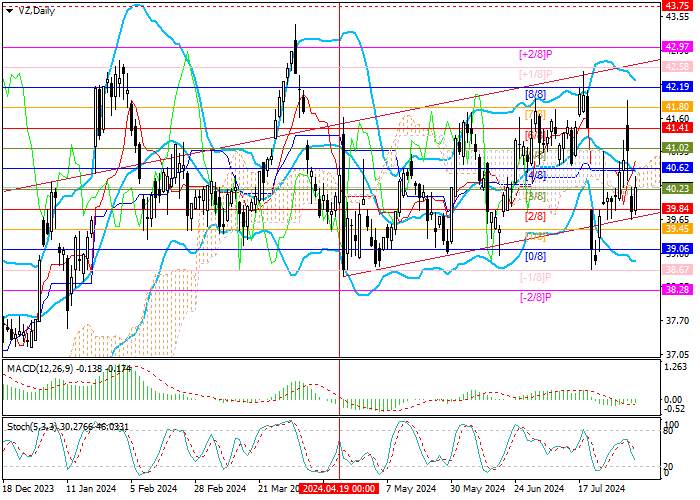
Current trend
Shares of Verizon Communications Inc., one of the largest American telecommunications companies, are moving within a long-term ascending channel. This week, the quotes fell to its lower limit of 39.84 (Murrey level [2/8]), consolidation below which will allow the asset to decline to the lower limit of the Murrey trading range of 39.06 (Murrey level [0/8]) and further into the reversal zone to 38.28 (Murrey level [–2/8]). Consolidation above 40.62 (Murrey level [4/8]), supported by the middle line of Bollinger Bands, will allow the asset to continue moving in the ascending channel to the area of 41.41 (Murrey level [6/8]), 42.19 (Murrey level [8/8]), 42.97 (Murrey level [ 2/8], the upper border of the ascending channel).
Technical indicators allow prices to fall: Bollinger Bands and Stochastic are reversing downwards, and the MACD histogram is stable in the negative zone.
Support and resistance
Resistance levels: 40.62, 41.41, 42.19, 42.97.
Support levels: 39.84, 39.06, 38.28.

Trading tips
Short positions may be opened below 39.84, with the targets at 39.06, 38.28, and stop loss 40.40. Implementation period: 5–7 days.
Long positions may be opened above 40.62, with the targets at 41.41, 42.19, 42.97, and stop loss 40.10.
风险提示:以上内容仅代表作者或嘉宾的观点,不代表 FOLLOWME 的任何观点及立场,且不代表 FOLLOWME 同意其说法或描述,也不构成任何投资建议。对于访问者根据 FOLLOWME 社区提供的信息所做出的一切行为,除非另有明确的书面承诺文件,否则本社区不承担任何形式的责任。
FOLLOWME 交易社区网址: followme.asia


加载失败()