| Scenario | |
|---|---|
| Timeframe | Intraday |
| Recommendation | BUY STOP |
| Entry Point | 0.6030 |
| Take Profit | 0.6100 |
| Stop Loss | 0.6000 |
| Key Levels | 0.5885, 0.5920, 0.5950, 0.5975, 0.6000, 0.6030, 0.6047, 0.6068 |
| Alternative scenario | |
|---|---|
| Recommendation | SELL STOP |
| Entry Point | 0.5970 |
| Take Profit | 0.5920 |
| Stop Loss | 0.6000 |
| Key Levels | 0.5885, 0.5920, 0.5950, 0.5975, 0.6000, 0.6030, 0.6047, 0.6068 |
Current trend
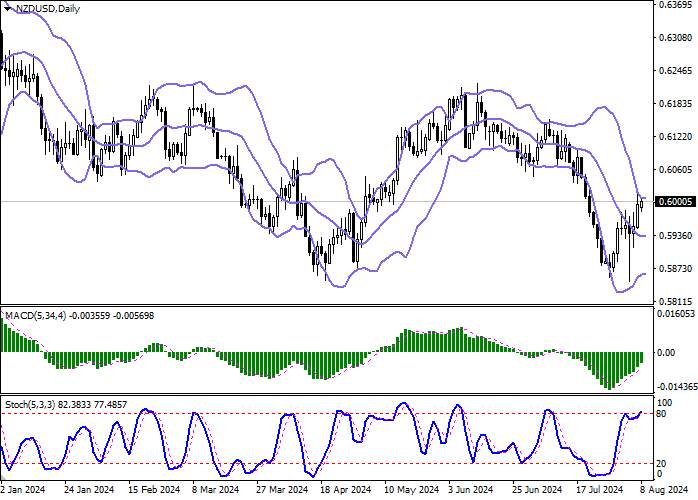
The NZD/USD pair is showing moderate growth, developing a fairly strong "bullish" trend in the short term, which was interrupted by a sharp decline on Monday. The instrument is testing 0.6000 for a breakout, while trading participants are analyzing macroeconomic statistics. The Reserve Bank of New Zealand's (RBNZ) Inflation Expectations for the third quarter were revised to 2.03% from 2.33%, which could put pressure on the regulator to further reduce borrowing costs.
The day before, New Zealand published a report on the labor market for the second quarter, according to which the Employment Rate increased by 0.4% after –0.2%, while analysts expected –0.2%, the Labor Cost Index in quarterly terms increased by 0.9%, accelerating by 0.1% from the previous value, and in annual terms a slowdown was recorded from 3.8% to 3.6% with a forecast of 3.5%. The Unemployment Rate rose sharply from 4.3% to 4.6%, while experts had expected 4.7%.
Today at 14:30 (GMT 2), the US will present data on the dynamics of jobless claims: Initial Jobless Claims for the week ended August 2 may decrease from 249.0 thousand to 240.0 thousand. Currently, the focus of American investors remains on the July report on the labor market: a sharp rise in unemployment has alarmed analysts, but now most observers believe that, despite the cooling of the key industry, a recession in the national economy will not occur. Moreover, experts expect a more significant adjustment in the US Federal Reserve's monetary policy, which will provide support for the dynamics of Gross Domestic Product (GDP). JPMorgan Chase & Co. analysts expect three cuts in borrowing costs during the year: by 50 basis points in September and November, and by another 25 basis points in December, although a more cautious approach is also possible.
Support and resistance
In the D1 chart, Bollinger Bands are reversing horizontally. The price range remains virtually unchanged, limiting the development of short-term "bulls". MACD grows, preserving a stable buy signal (located above the signal line). Stochastic demonstrates similar dynamics; however, the indicator is located in close proximity to its highs, indicating the risks of the instrument being overbought in the ultra-short term.
Resistance levels: 0.6000, 0.6030, 0.6047, 0.6068.
Support levels: 0.5975, 0.5950, 0.5920, 0.5885.


Trading tips
Long positions can be opened after a breakout of 0.6030 with the target of 0.6100. Stop-loss — 0.6000. Implementation time: 2-3 days.
The return of a "bearish" trend with the breakdown of 0.5975 may become a signal for new short positions with the target at 0.5920. Stop-loss — 0.6000.
风险提示:以上内容仅代表作者或嘉宾的观点,不代表 FOLLOWME 的任何观点及立场,且不代表 FOLLOWME 同意其说法或描述,也不构成任何投资建议。对于访问者根据 FOLLOWME 社区提供的信息所做出的一切行为,除非另有明确的书面承诺文件,否则本社区不承担任何形式的责任。
FOLLOWME 交易社区网址: followme.asia


加载失败()