| Scenario | |
|---|---|
| Timeframe | Weekly |
| Recommendation | SELL STOP |
| Entry Point | 56000.00 |
| Take Profit | 53125.00, 50000.00 |
| Stop Loss | 58500.00 |
| Key Levels | 50000.00, 53125.00, 56250.00, 60000.00, 62500.00, 65625.00 |
| Alternative scenario | |
|---|---|
| Recommendation | BUY STOP |
| Entry Point | 60100.00 |
| Take Profit | 62500.00, 65625.00 |
| Stop Loss | 58000.00 |
| Key Levels | 50000.00, 53125.00, 56250.00, 60000.00, 62500.00, 65625.00 |
Current trend
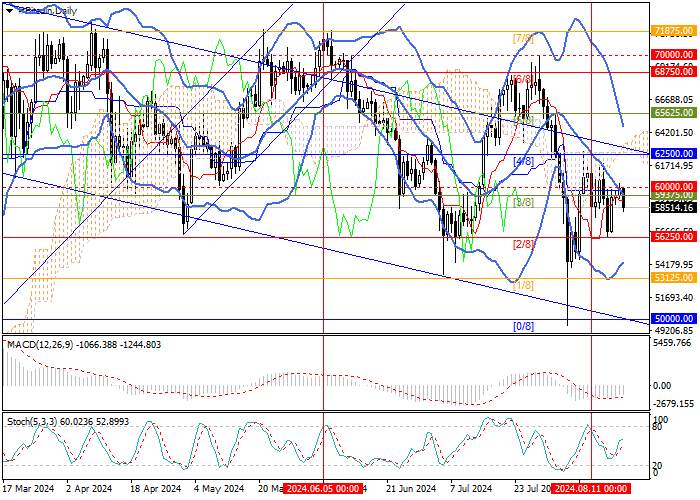
Last week, the BTC/USD pair had ambiguous dynamics and traded at 59375.00 (Murrey level [3/8]), where it is currently holding.
Investors are in no hurry to open new positions after the publication of ambiguous US statistics. Building permits fell by 4.0% to 1.396M, housing starts by 6.8% to 1.238M but consumer inflation confirmed a slowdown. The consumer price index fell from 3.0% to 2.9% YoY, and the core indicator – from 3.3% to 3.2%. Thus, the September interest rate cut by the US Fed has become almost inevitable. The easing of monetary policy should weaken the position of the American currency against alternative assets. However, this time. it will probably happen while maintaining serious economic growth, allowing the dollar to remain an attractive investment instrument.
The restraint of large players is confirmed by data on capital investments in Bitcoin ETFs, which last week amounted to only 32.4M dollars. Also, the resumption of growth in the quotes of digital gold is hindered by the transfer of 10.0K BTC coins to the Coinbase Prime platform, which acts as a custodian for frozen funds, by the US Marshals Service. These tokens were confiscated from the Silk Road marketplace in 2023 and now, according to experts, will be sold during auction trading.
Support and resistance
Technically, the BTC/USD pair is moving within the downward channel. A breakout of the support zone 59375.00–60000.00, supported by the middle line of Bollinger Bands, will allow it to resume its upward trend, with the targets of 62500.00 (Murrey level [4/8]) and 65625.00 (Murrey level [5/8]). A breakdown of the key “bearish” level of 56250.00 (Murrey level [2/8]) allows a decline to 53125.00 (Murrey level [1/8]) and 50000.00 (Murrey level [0/8]).
Technical indicators confirm the continuation of the downward trend: Bollinger bands are directed downwards, the MACD histogram is stable in the negative zone, and Stochastic has turned around, not excluding new growth, the potential of which, however, is still limited.
Resistance levels: 60000.00, 62500.00, 65625.00.
Support levels: 56250.00, 53125.00, 50000.00.

Trading tips
Short positions may be opened below 56250.00, with the targets at 53125.00, 50000.00 and stop loss 58500.00. Implementation period: 5–7 days.
Long positions may be opened above 60000.00, with the targets at 62500.00, 65625.00, and stop loss 58000.00.
风险提示:以上内容仅代表作者或嘉宾的观点,不代表 FOLLOWME 的任何观点及立场,且不代表 FOLLOWME 同意其说法或描述,也不构成任何投资建议。对于访问者根据 FOLLOWME 社区提供的信息所做出的一切行为,除非另有明确的书面承诺文件,否则本社区不承担任何形式的责任。
FOLLOWME 交易社区网址: followme.asia


加载失败()