Shares of Cisco Systems Inc., an American manufacturer and supplier of network equipment for large holdings and telecommunications companies, are trading around 49.50.
On the daily chart, the price tries to leave the downward channel with dynamic boundaries of 48.60–43.60.
On the four-hour chart, the quotes have consolidated above the previous high of 48.80, which is an indirect confirmation of the exit from the range. In addition, the recently formed price gap between the 48.50 and 45.30 marks gives confidence in the strengthening of the upward movement.
Technical indicators gave a signal to open long positions last week: fast EMA on the Alligator indicator crossed the signal line upwards, and the AO oscillator histogram forms new correction bars, rising in the buy zone.
Trading tips
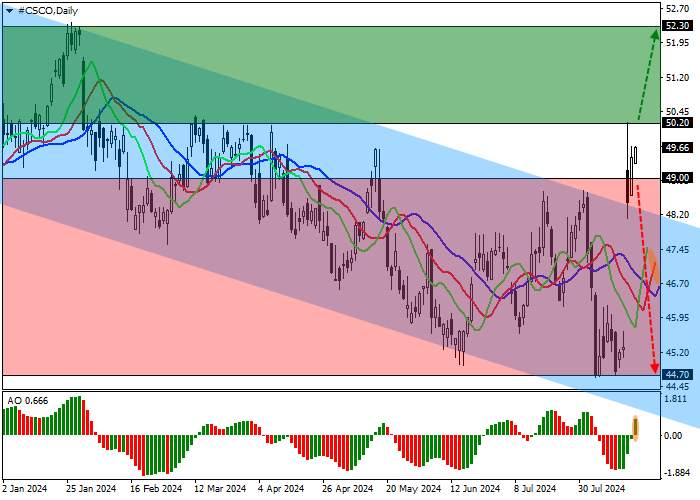
Long positions may be opened after the price consolidates above the resistance level of 50.20, with the target at 52.30. Stop loss – 49.00. Implementation period: 7 days or more.
Short positions may be opened after the price consolidates below the support level of 49.00, with the target at 44.70. Stop loss – 51.00.


加载失败()