| Scenario | |
|---|---|
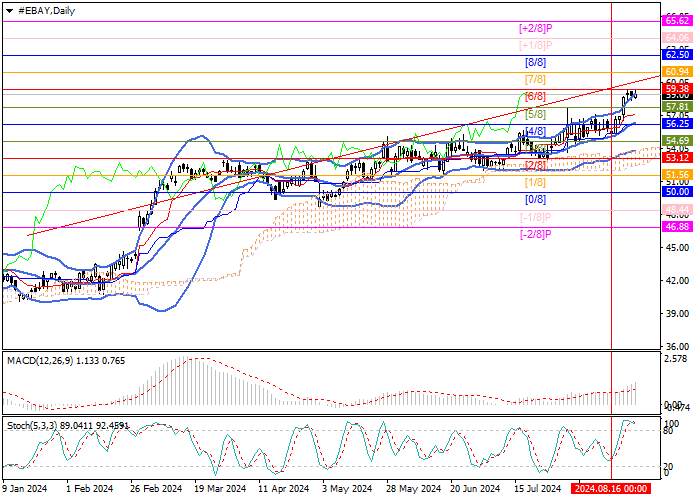
| Timeframe | Weekly |
| Recommendation | BUY STOP |
| Entry Point | 59.40 |
| Take Profit | 60.94, 62.50 |
| Stop Loss | 58.25 |
| Key Levels | 51.56, 53.12, 56.25, 59.38, 60.94, 62.50 |
| Alternative scenario | |
|---|---|
| Recommendation | SELL STOP |
| Entry Point | 56.20 |
| Take Profit | 53.12, 51.56 |
| Stop Loss | 58.00 |
| Key Levels | 51.56, 53.12, 56.25, 59.38, 60.94, 62.50 |
Current trend
Shares of eBay Inc., an American online retailing company, are trading within the long-term uptrend: last week, the price moved into the positive part of the main Murrey trading range and is currently actively testing the reversal mark of 59.38 (Murrey level [6/8]), consolidation above which will ensure continued growth towards the targets of 60.94 (Murrey level [7/8]) and 62.50 (Murrey level [8/8]). The key for the "bears" is the central mark of the trading range at 56.25 (Murrey level [4/8]), supported by the central line of Bollinger Bands, with a breakdown of which downward dynamics can resume to 53.12 (Murrey level [2/8]) and 51.56 (Murrey level [1/8]).
Technical indicators confirm the continuation of the uptrend: Bollinger Bands are directed upwards, MACD is increasing in the positive zone, and Stochastic is reversing down in the overbought zone, which does not exclude a corrective decline, but its potential is seen to be limited.
Support and resistance
Resistance levels: 59.38, 60.94, 62.50.
Support levels: 56.25, 53.12, 51.56.

Trading tips
Long positions can be opened above the 59.38 mark with targets of 60.94, 62.50 and a stop-loss around 58.25. Implementation period: 5–7 days.
Short positions should be opened below the level of 56.25 with targets of 53.12, 51.56 and a stop-loss around 58.00.
风险提示:以上内容仅代表作者或嘉宾的观点,不代表 FOLLOWME 的任何观点及立场,且不代表 FOLLOWME 同意其说法或描述,也不构成任何投资建议。对于访问者根据 FOLLOWME 社区提供的信息所做出的一切行为,除非另有明确的书面承诺文件,否则本社区不承担任何形式的责任。
FOLLOWME 交易社区网址: followme.asia


加载失败()