| Scenario | |
|---|---|
| Timeframe | Intraday |
| Recommendation | BUY STOP |
| Entry Point | 75.00 |
| Take Profit | 77.00 |
| Stop Loss | 74.00 |
| Key Levels | 71.75, 72.41, 73.00, 74.00, 75.00, 76.00, 77.00, 78.00 |
| Alternative scenario | |
|---|---|
| Recommendation | SELL STOP |
| Entry Point | 74.00 |
| Take Profit | 73.00 |
| Stop Loss | 74.50 |
| Key Levels | 71.75, 72.41, 73.00, 74.00, 75.00, 76.00, 77.00, 78.00 |
Current trend
During the Asian session, prices for WTI Crude Oil are recovering after a two-day decline, which led to a renewal of the lows of August 23, and are testing 74.15 for a breakout with the support of American macroeconomic statistics.
Thus, the report from the American Petroleum Institute (API) reflected a decrease in commercial fuel stocks for the week of August 23 by 3.4M barrels after an increase of 0.347M barrels earlier compared to forecasts of –3.0M barrels. Similar data from the Energy Information Administration of the US Department of Energy (EIA) for the week of August 23 indicated a more restrained change in the indicator from –4.649M barrels to –0.846M barrels, although analysts expected –3.000M barrels.
Investors are awaiting key publications that may influence the dynamics of the American dollar. Thus, on Friday at 14:30 (GMT 2), they will pay attention to the July core price index of personal consumption expenditures, which, according to preliminary estimates, will increase from 2.6% to 2.7%, which may put pressure on US Fed officials to adjust the cost of borrowing during the September meeting. In addition, the dynamics of personal income and household expenditures for the same period will be released, where the indicator is likely to be consolidated around 0.2% and will increase from 0.3% to 0.5%, respectively.
The correction continues on the oil market: according to the latest report from the US Commodity Futures Trading Commission (CFTC), last week, the number of net speculative positions in WTI Crude Oil decreased from 231.5K to 222.3K. The gap in favor of buyers remains despite the general outflow of investors from the asset. The balance of “bulls” among producers amounted to 368.960K against 326.302K among “bears.” Last week, buyers closed 30.059K transactions, and sellers – 33.425K, confirming a local drop in demand.
Support and resistance
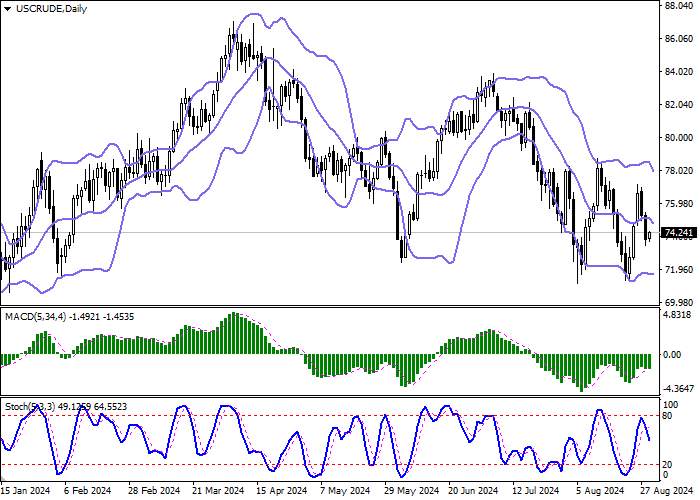
On the daily chart, Bollinger Bands are trying to reverse into a downward plane. The price range narrows from above, reflecting the emergence of ambiguous trading dynamics in the short term. The MACD indicator is forming a sell signal (the histogram tends to be located below the signal line). Stochastic, having retreated from the level of “80”, keeping a confident downward direction, signaling in favor of further development of the downward trend in the ultra-short term.
Resistance levels: 75.00, 76.00, 77.00, 78.00.
Support levels: 74.00, 73.00, 72.41, 71.75.


Trading tips
Long positions may be opened after a breakout of 75.00, with the target at 77.00. Stop loss – 74.00. Implementation period: 2–3 days.
Short positions may be opened after a decline and a breakdown of 74.00, with the target at 73.00. Stop loss – 74.50.
风险提示:以上内容仅代表作者或嘉宾的观点,不代表 FOLLOWME 的任何观点及立场,且不代表 FOLLOWME 同意其说法或描述,也不构成任何投资建议。对于访问者根据 FOLLOWME 社区提供的信息所做出的一切行为,除非另有明确的书面承诺文件,否则本社区不承担任何形式的责任。
FOLLOWME 交易社区网址: followme.asia


加载失败()