| Scenario | |
|---|---|
| Timeframe | Weekly |
| Recommendation | SELL STOP |
| Entry Point | 0.8390 |
| Take Profit | 0.8300 |
| Stop Loss | 0.8440 |
| Key Levels | 0.8300, 0.8390, 0.8430, 0.8500 |
| Alternative scenario | |
|---|---|
| Recommendation | BUY STOP |
| Entry Point | 0.8430 |
| Take Profit | 0.8500 |
| Stop Loss | 0.8390 |
| Key Levels | 0.8300, 0.8390, 0.8430, 0.8500 |
Current trend
The European currency is trading at low levels, which is noticeable for its main competitors, excluding the American dollar, and the EUR/GBP pair is currently moving in a downward trend at 0.8409.
Yesterday, data on the consumer price index in Germany was published, recording a slowdown in inflation to 1.9% from 2.3% previously. The indicator harmonized with EU standards corrected from 2.6% to 2.0%, reaching a low since March 2021. Investors are also focusing on French statistics, which showed a slight recovery of the Q2 economy by 0.2%, which led to a drop in the gross domestic product (GDP) to 1.0% from 1.1% YoY. The consumer price index changed from 2.3% to 1.9%, for the first time in several years entering the target range of the European Central Bank (ECB) below 2.0%.
Neutral macroeconomic indicators could not support the pound. Approved mortgages amounted to 61.99K, higher than 59.98K last month, mortgage lending increased to 2.79B pounds from 2.65B pounds, and net borrowing decreased from 3.86B pounds to 4.01B pounds. Statistics reflect the recovery of demand for credit products due to the improvement in the purchasing power against the imminent change in the monetary rate by the Bank of England.
Against this background, the EUR/GBP pair will most likely continue to trade in a wide sideways range with a possible shift in the downward direction.
Support and resistance
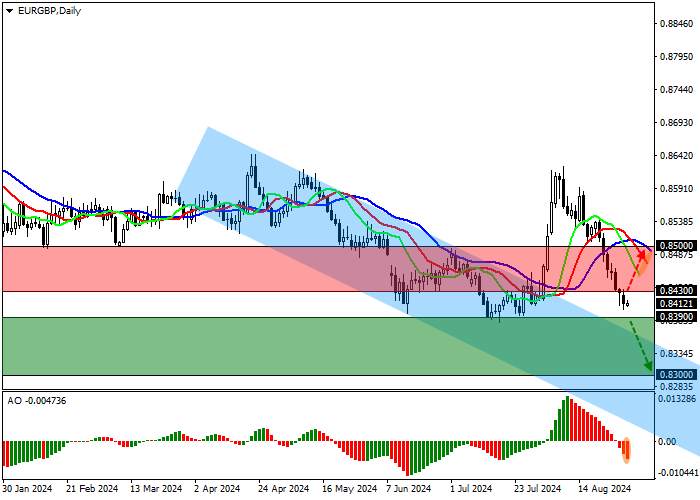
The trading instrument is moving above the global downwards channel with dynamic boundaries of 0.8350–0.8100, preparing for a reverse test of the channel resistance line.
Technical indicators have given a sell signal: fast EMAs on the Alligator indicator are moving away from the signal line, and the AO histogram is forming downward bars below the transition level.
Resistance levels: 0.8430, 0.8500.
Support levels: 0.8390, 0.8300.

Trading tips
Short positions may be opened after the price declines and consolidates below 0.8390, with the target at 0.8300. Stop loss — 0.8440. Implementation period: 7 days or more.
Long positions may be opened after the price grows and consolidates above 0.8430, with the target around 0.8500. Stop loss — around 0.8390.
风险提示:以上内容仅代表作者或嘉宾的观点,不代表 FOLLOWME 的任何观点及立场,且不代表 FOLLOWME 同意其说法或描述,也不构成任何投资建议。对于访问者根据 FOLLOWME 社区提供的信息所做出的一切行为,除非另有明确的书面承诺文件,否则本社区不承担任何形式的责任。
FOLLOWME 交易社区网址: followme.asia


加载失败()