| Scenario | |
|---|---|
| Timeframe | Intraday |
| Recommendation | SELL STOP |
| Entry Point | 0.6725 |
| Take Profit | 0.6675 |
| Stop Loss | 0.6750 |
| Key Levels | 0.6646, 0.6675, 0.6700, 0.6725, 0.6750, 0.6775, 0.6800, 0.6825 |
| Alternative scenario | |
|---|---|
| Recommendation | BUY |
| Entry Point | 0.6752 |
| Take Profit | 0.6800 |
| Stop Loss | 0.6725 |
| Key Levels | 0.6646, 0.6675, 0.6700, 0.6725, 0.6750, 0.6775, 0.6800, 0.6825 |
Current trend
The AUD/USD pair is showing a confident decline, testing 0.6740 for a breakdown and updating local lows from August 23. At the same time, there are no significant drivers for the development of "bearish" dynamics, and American investors are expecting the publication of key macroeconomic statistics on the labor market only at the end of the week. However, some pressure on the Australian currency's position today was exerted by the country's Current Account Balance data: thus, in the second quarter, the balance of payments deficit increased from –4.9 billion Australian dollars to –10.7 billion Australian dollars, with a forecast of –5.9 billion Australian dollars.
However, the trading instrument still receives some support from the data released on Monday. Australia's Building Permits rose 10.4% in July, up 6.4% from –6.4% the previous month, compared with analysts' expectations of 2.5%, and were up 14.3% year-on-year from –3.7%. In turn, in August, the Manufacturing PMI rose from 47.5 points to 48.5 points, failing to meet the forecast of 48.7 points: the industry is slowing down at a moderate pace under pressure from high inflation and the tight monetary policy of the Reserve Bank of Australia (RBA), which may completely abandon its easing by the end of the year. It is also worth noting data from China, where the Caixin Manufacturing PMI rose from 49.8 points to 50.4 points in August, ahead of expectations of 50.0 points.
Tomorrow at 3:30 (GMT 2), Australia will release statistics on Gross Domestic Product (GDP) for the second quarter: analysts expect the quarterly figure to be revised up from 0.1% to 0.3% and the annual figure to be revised up from 1.1% to 1.0%. Also, during the day, investors will be assessing July data on business activity in the manufacturing and construction sectors from the Australian Industry Group (AiG) and August inflation statistics from TD Securities.
Support and resistance
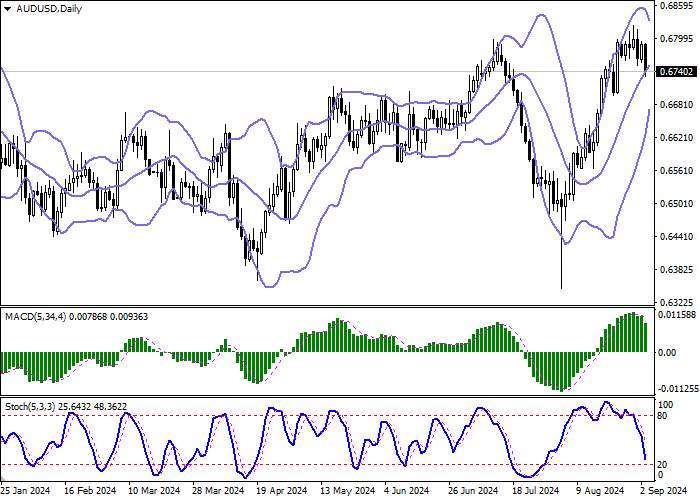
Bollinger Bands on the daily chart show a steady increase. The price range is actively narrowing, reflecting ambiguous nature of trading in the short term. MACD is going down preserving a stable sell signal (located below the signal line). Stochastic retains confident downward direction, but is quickly approaching its lows, indicating the risks of the Australian dollar being oversold in the ultra-short term.
Resistance levels: 0.6750, 0.6775, 0.6800, 0.6825.
Support levels: 0.6725, 0.6700, 0.6675, 0.6646.


Trading tips
Short positions may be opened after a breakdown of 0.6725 with the target at 0.6675. Stop-loss — 0.6750. Implementation time: 1-2 days.
A rebound from 0.6725 as from support followed by a breakout of 0.6750 may become a signal for opening new long positions with the target at 0.6800. Stop-loss — 0.6725.
风险提示:以上内容仅代表作者或嘉宾的观点,不代表 FOLLOWME 的任何观点及立场,且不代表 FOLLOWME 同意其说法或描述,也不构成任何投资建议。对于访问者根据 FOLLOWME 社区提供的信息所做出的一切行为,除非另有明确的书面承诺文件,否则本社区不承担任何形式的责任。
FOLLOWME 交易社区网址: followme.asia


加载失败()