| Scenario | |
|---|---|
| Timeframe | Intraday |
| Recommendation | BUY STOP |
| Entry Point | 74.00 |
| Take Profit | 76.00 |
| Stop Loss | 73.00 |
| Key Levels | 71.00, 71.75, 72.35, 73.00, 74.00, 75.00, 76.00, 77.00 |
| Alternative scenario | |
|---|---|
| Recommendation | SELL |
| Entry Point | 73.00 |
| Take Profit | 71.00 |
| Stop Loss | 74.00 |
| Key Levels | 71.00, 71.75, 72.35, 73.00, 74.00, 75.00, 76.00, 77.00 |
Current trend
During the Asian session, WTI Crude Oil prices are showing ambiguous dynamics, holding near the level of 73.40. Activity on the market remains low. However, the quotes are trying to recover, taking advantage of the fact that trading floors in the US were closed on Monday for the Labor Day holiday, which creates some pressure on the positions of the American currency.
Geopolitical factors support the positive dynamics. The situation in the Middle East remains stable, and the risks of a possible attack by Iran in response to the death of the head of the Hamas political bureau, Ismail Haniyeh, are gradually decreasing. However, yesterday, in the Red Sea, the Iran-backed Yemeni Houthis attacked two tankers with crude oil – the Amjad under the Flag of Saudi Arabia and the Panamanian Blue Lagoon I. In turn, the decline in exports from Libya against intensifying internal political conflicts is offset by the restoration of oil production volumes in the United States, Canada, Brazil, Guyana, and several other regions, helping to overcome the slowdown in OPEC production.
Tomorrow at 22:30 (GMT 2), traders wait for a report from the American Petroleum Institute (API) on the dynamics of commercial reserves for the week of August 30. Previously, a decrease of 3.4M barrels was observed. The final statistics from the Energy Information Administration of the US Department of Energy (EIA) are due on Thursday at 17:00 (GMT 2). In addition, on September 5 at 14:15 (GMT 2), investors will pay attention to the information from Automatic Data Processing (ADP) on private-sector employment. At the end of the week, August data from the labor market is due, which may affect the size of the expected interest rate cut by the US Fed during the September meeting.
The correction continues in the oil market. According to the latest report from the US Commodity Futures Trading Commission (CFTC), last week, net speculative positions in WTI Crude Oil increased from 222.3K to 226.7K. As for the dynamics, the gap in favor of buyers remains amid investors’ exit from the asset. The balance of “bulls” among producers amounted to 361.792K against 309.087K among “bears”. Last week, buyers closed 7.168K transactions, while sellers closed 17.215K, which reflects a decrease in demand for contracts.
Support and resistance
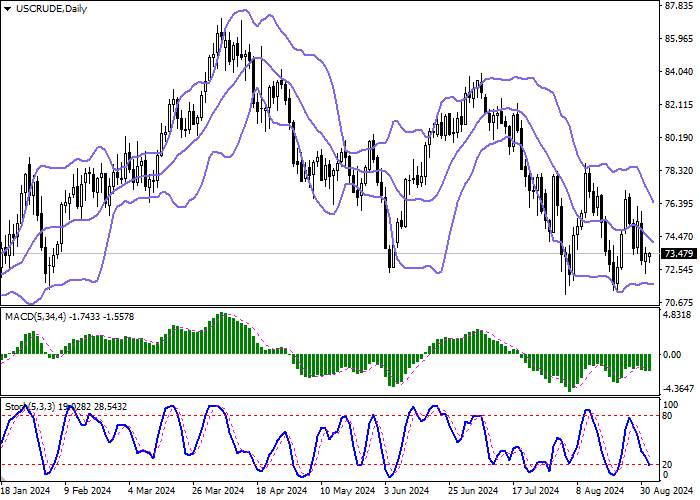
On the daily chart, Bollinger bands are moderately declining. The price range is narrowing, signaling the emergence of ambiguous trading dynamics in the short term. The MACD indicator is declining, maintaining a poor sell signal (the histogram is below the signal line). Stochastic maintains a confident downward direction but is quickly approaching its lows, indicating that the trading instrument may become oversold in the ultra-short term.
Resistance levels: 74.00, 75.00, 76.00, 77.00.
Support levels: 73.00, 72.35, 71.75, 71.00.


Trading tips
Long positions may be opened after a breakout of 74.00, with the target at 76.00. Stop loss — 73.00. Implementation period: 2–3 days.
Short positions may be opened after a decline and a breakdown of 73.00, with the target at 71.00. Stop loss — 74.00.
风险提示:以上内容仅代表作者或嘉宾的观点,不代表 FOLLOWME 的任何观点及立场,且不代表 FOLLOWME 同意其说法或描述,也不构成任何投资建议。对于访问者根据 FOLLOWME 社区提供的信息所做出的一切行为,除非另有明确的书面承诺文件,否则本社区不承担任何形式的责任。
FOLLOWME 交易社区网址: followme.asia


加载失败()