| Scenario | |
|---|---|
| Timeframe | Weekly |
| Recommendation | SELL STOP |
| Entry Point | 123.50 |
| Take Profit | 110.80, 100.00 |
| Stop Loss | 135.00 |
| Key Levels | 100.00, 110.80, 125.00, 143.00, 162.50, 175.00 |
| Alternative scenario | |
|---|---|
| Recommendation | BUY STOP |
| Entry Point | 144.00 |
| Take Profit | 162.50, 175.00 |
| Stop Loss | 132.00 |
| Key Levels | 100.00, 110.80, 125.00, 143.00, 162.50, 175.00 |
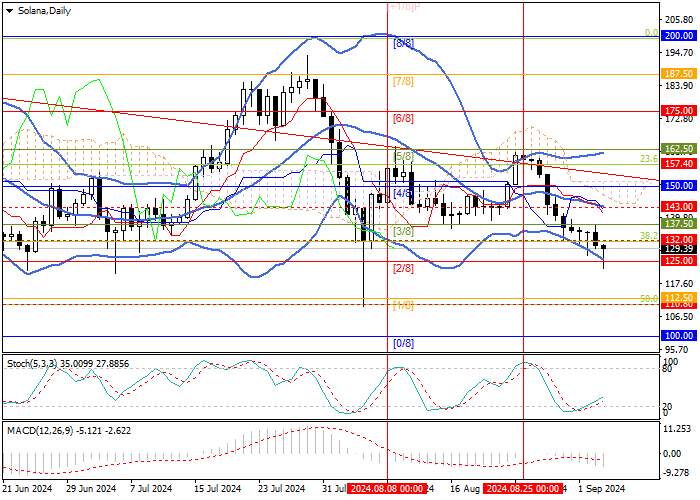
Current trend
The SOL/USD pair continues its active decline within the general market trend: last week, the price again tested the 162.50 mark (Murrey level [5/8]) but failed to consolidate above it and began a downward rollback. Currently, the instrument is close to a strong resistance level of 125.00 (Murrey level [2/8]), which it has been trying to break through since April. If successful, the decline will be able to continue to the targets of 110.80 (50.0% Fibonacci retracement, Murrey level [1/8]) and 100.00 (Murrey level [0/8]). The key for the “bulls” seems to be the central line of Bollinger Bands around 143.00, and its breakout will allow quotes to return to the levels of 162.50 (Murrey level [5/8]) and 175.00 (Murrey level [6/8]).
Technical indicators confirm the continuation of the short-term downtrend: Bollinger Bands are reversing down, MACD is increasing in the negative zone, and Stochastic is reversing up from the oversold zone, which does not exclude the resumption of growth, but its potential seems limited.
Support and resistance
Resistance levels: 143.00, 162.50, 175.00.
Support levels: 125.00, 110.80, 100.00.

Trading tips
Short positions can be opened below 125.00 with targets at 110.80, 100.00 and a stop-loss at 135.00. Implementation period: 5–7 days.
Long positions can be opened above the 143.00 mark with targets at 162.50, 175.00 and a stop-loss at 132.00.
风险提示:以上内容仅代表作者或嘉宾的观点,不代表 FOLLOWME 的任何观点及立场,且不代表 FOLLOWME 同意其说法或描述,也不构成任何投资建议。对于访问者根据 FOLLOWME 社区提供的信息所做出的一切行为,除非另有明确的书面承诺文件,否则本社区不承担任何形式的责任。
FOLLOWME 交易社区网址: followme.asia


加载失败()