| Scenario | |
|---|---|
| Timeframe | Intraday |
| Recommendation | BUY STOP |
| Entry Point | 0.8500 |
| Take Profit | 0.8600 |
| Stop Loss | 0.8450 |
| Key Levels | 0.8331, 0.8365, 0.8400, 0.8450, 0.8500, 0.8541, 0.8570, 0.8600 |
| Alternative scenario | |
|---|---|
| Recommendation | SELL STOP |
| Entry Point | 0.8450 |
| Take Profit | 0.8365 |
| Stop Loss | 0.8500 |
| Key Levels | 0.8331, 0.8365, 0.8400, 0.8450, 0.8500, 0.8541, 0.8570, 0.8600 |
Current trend
The USD/CHF pair is showing moderate growth, correcting after the "bearish" last week, as a result of which the instrument managed to update the record lows of late December for some time. The instrument is testing 0.8460 for a breakout, while the growth of the American currency is largely facilitated by technical factors.
Investors are assessing the August data on the US labor market, published last Friday: thus, Nonfarm Payrolls amounted to 142.0 thousand, which was significantly lower than expectations at 160.0 thousand, while analysts drew attention to the revision of the July figure from 114.0 thousand to 89.0 thousand, which ultimately led to a sharp surge in volatility in the Friday session. Average Hourly Earnings accelerated from 0.2% to 0.4% month-on-month and from 3.6% to 3.8% year-on-year, compared to forecasts of 0.3% and 3.7%, respectively. Against this backdrop, expectations regarding the size of the expected cut in the US Federal Reserve interest rate in September have remained virtually unchanged: as before, the scenario with an immediate adjustment of the rate by –50 basis points is estimated at approximately 35.0%.
Switzerland released its Unemployment statistics for August last Thursday, and as expected, the figure remained at 2.5%. Analysts, like with the US regulator, expect the Swiss National Bank to cut borrowing costs at its meeting on September 26 as inflation pressures in the country continue to ease rapidly. The country's Consumer Price Index slowed down in August from 1.3% to 1.1%, compared to preliminary estimates of 1.2%.
Support and resistance
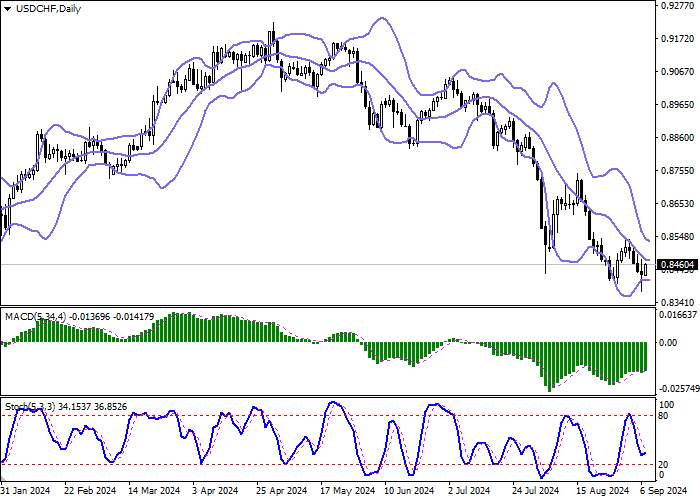
On the daily chart Bollinger Bands are trying to reverse horizontally. The price range is narrowing, reflecting appearance of multi-directional dynamics in the short term. MACD is growing preserving a weak buy signal (located above the signal line). Stochastic interrupted its active decline and reversed into a horizontal plane, not far from the level of "20". One should wait for the clarification of trade signals.
Resistance levels: 0.8500, 0.8541, 0.8570, 0.8600.
Support levels: 0.8450, 0.8400, 0.8365, 0.8331.


Trading tips
Long positions can be opened after a breakout of 0.8500 with the target of 0.8600. Stop-loss — 0.8450. Implementation time: 2-3 days.
A rebound from 0.8500 as from resistance, followed by a breakdown of 0.8450 may become a signal for opening of new short positions with the target at 0.8365. Stop-loss — 0.8500.
风险提示:以上内容仅代表作者或嘉宾的观点,不代表 FOLLOWME 的任何观点及立场,且不代表 FOLLOWME 同意其说法或描述,也不构成任何投资建议。对于访问者根据 FOLLOWME 社区提供的信息所做出的一切行为,除非另有明确的书面承诺文件,否则本社区不承担任何形式的责任。
FOLLOWME 交易社区网址: followme.asia


加载失败()