Shares of ExxonMobil Corp., an American oil company, are trading in a correction trend at 117.00.
On the daily chart, the price returned to the ascending channel of 124.00–116.00 and is moving away from the support line.
On the four-hour chart, after the quotes consolidate above the support line of the range of 116.00 and the high of 118.00, they may reach the resistance level of 123.00. After a reversal and decline, the asset will leave the channel and return to the autumn low of 108.00.
Technical indicators are holding a poor sell signal: fast EMAs on the Alligator indicator are approaching the signal line, and the AO histogram is forming new bars below the transition level.
Trading tips
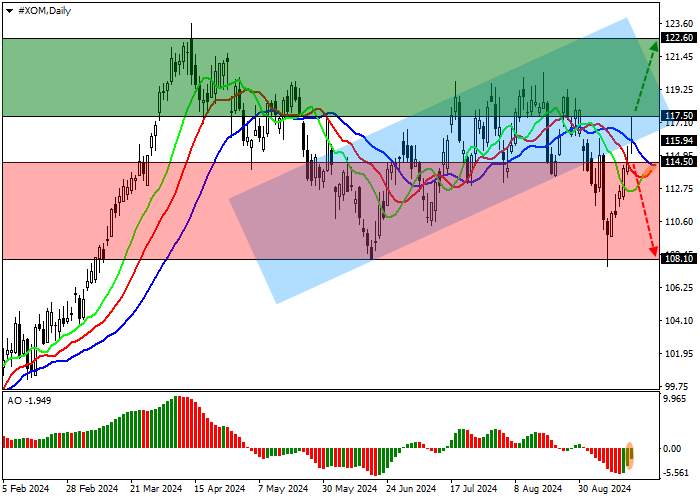
Long positions may be opened after the price rises and consolidates above 117.50, with the target at 122.60. Stop loss is around 115.00. Implementation period: 7 days or more.
Short positions may be opened after the price falls and consolidates below 114.50, with the target at 108.10. Stop loss is 116.00.


加载失败()