Shares of 3M Co., an American diversified innovation and manufacturing company, are trading at 135.00.
On the daily chart, the price is moving within an ascending channel with dynamic boundaries of 140.00–130.00.
On the four-hour chart, the quotes could not leave the range, reversed at the channel support line of 129.00, and continued to rise, reaching an annual high of 135.00, after overcoming which they will be able to grow to 145.00. In the event of a reversal and a repeated attempt to exit the channel with a breakout of the 130.00 mark, downward dynamics may develop.
Technical indicators are holding a buy signal: fast EMAs on the Alligator indicator are above the signal line, and the AO histogram is forming correction bars in the buy zone.
Trading tips
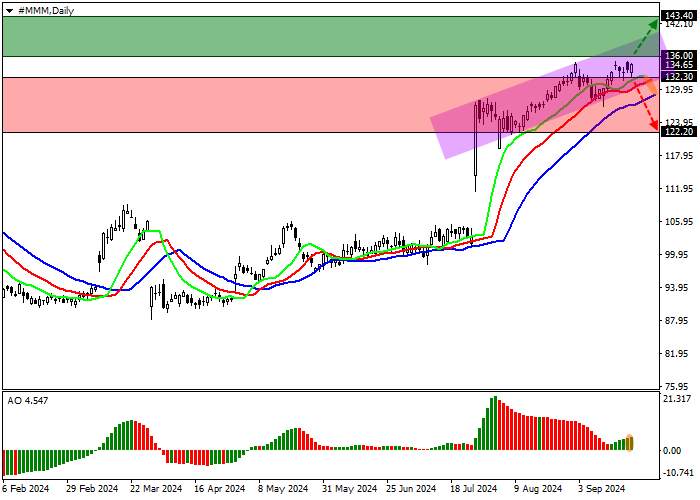
Long positions may be opened after the price rises and consolidates above 136.00, with the target at 143.40. Stop loss — 134.00. Implementation period: 7 days or more.
Short positions may be opened after the price falls and consolidates below 132.30, with the target at 122.20. Stop loss — 135.00.


加载失败()