| Scenario | |
|---|---|
| Timeframe | Intraday |
| Recommendation | BUY STOP |
| Entry Point | 2640.00 |
| Take Profit | 2670.00 |
| Stop Loss | 2623.84 |
| Key Levels | 2589.61, 2600.00, 2613.83, 2623.84, 2640.00, 2655.00, 2670.00, 2685.00 |
| Alternative scenario | |
|---|---|
| Recommendation | SELL STOP |
| Entry Point | 2623.80 |
| Take Profit | 2589.61 |
| Stop Loss | 2640.00 |
| Key Levels | 2589.61, 2600.00, 2613.83, 2623.84, 2640.00, 2655.00, 2670.00, 2685.00 |
Current trend
The XAU/USD pair continues to grow quite actively, updating record highs and holding near 2640.00 during the Asian session. The upward trend is supported by the US Federal Reserve's decision to cut borrowing costs by 50 basis points, which allows market participants to expect continued easing of monetary parameters.
Now investors are adjusting their forecasts for interest rate cuts from the European Central Bank (ECB), the Bank of England and a number of other major financial regulators, while the US Fed is planning at least two more adjustments to the indicator by –25 or even –50 basis points before the end of this year. The US Federal Reserve officials also changed their estimates for inflation dynamics from 2.6% to 2.3% for 2024 and from 2.3% to 2.1% for 2025, Gross Domestic Product (GDP) from 2.1% to 2.0%, and Unemployment from 4.0% to 4.4%.
Another factor in the growth of the XAU/USD pair is the ongoing uncertainty: first of all, this concerns the development of military conflicts in Eastern Europe and the Middle East. Israel's latest attacks on Lebanon could lead to a significant escalation in the region if Iran also announces its involvement in the fighting. This, in turn, practically nullifies the parties’ earlier plans for a ceasefire in the Gaza Strip. It is also worth noting the upcoming US presidential elections, which will take place in November: investors assume that in the event of a possible victory by Republican candidate Donald Trump, the vector of the country's foreign policy will be significantly changed, which will also affect the geopolitical situation around the world.
Meanwhile, according to the US Commodity Futures Trading Commission (CFTC) report, the number of net speculative positions in gold rose to 310.1 thousand from 282.5 thousand last week, and the total number of contracts exceeded 300.0 thousand for the first time since 2020. The balance of the "bulls" in positions secured by real money amounted to 273.295 thousand versus 20.667 thousand for the "bears". Last week, buyers opened 22.082 thousand transactions, and sellers — 1.182 thousand, which indicates the continuing confidence of investors in the continuation of the growth of quotes.
Support and resistance
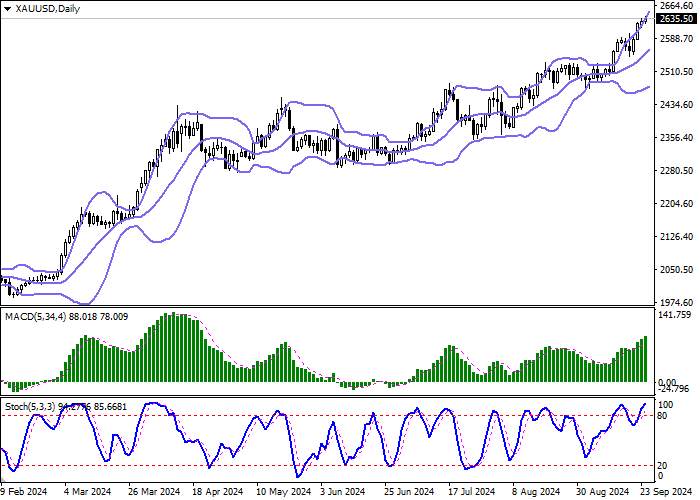
Bollinger Bands on the daily chart show a steady increase. The price range expands from above, freeing a path to new record highs for the "bulls". MACD grows, preserving a stable buy signal (located above the signal line). Stochastic retains a steady uptrend, but is located in close proximity to its highs, which points to the risk of overbought gold in the ultra-short term.
Resistance levels: 2640.00, 2655.00, 2670.00, 2685.00.
Support levels: 2623.84, 2613.83, 2600.00, 2589.61.


Trading tips
Long positions can be opened after a breakout of 2640.00 with the target of 2670.00. Stop-loss — 2623.84. Implementation time: 1-2 days.
A rebound from 2640.00 as from resistance, followed by a breakdown of 2623.84 may become a signal for opening of short positions with the target at 2589.61. Stop-loss — 2640.00.
风险提示:以上内容仅代表作者或嘉宾的观点,不代表 FOLLOWME 的任何观点及立场,且不代表 FOLLOWME 同意其说法或描述,也不构成任何投资建议。对于访问者根据 FOLLOWME 社区提供的信息所做出的一切行为,除非另有明确的书面承诺文件,否则本社区不承担任何形式的责任。
FOLLOWME 交易社区网址: followme.asia


加载失败()