| Scenario | |
|---|---|
| Timeframe | Weekly |
| Recommendation | SELL STOP |
| Entry Point | 2812.50 |
| Take Profit | 2187.50, 1875.00 |
| Stop Loss | 2700.00 |
| Key Levels | 1875.00, 2187.50, 2500.00, 2812.50, 3125.00, 3437.50 |
| Alternative scenario | |
|---|---|
| Recommendation | SELL LIMIT |
| Entry Point | 2812.50 |
| Take Profit | 2187.50, 1875.00 |
| Stop Loss | 3000.00 |
| Key Levels | 1875.00, 2187.50, 2500.00, 2812.50, 3125.00, 3437.50 |
Current trend
Last week, the ETH/USD pair actively increased as part of the general market trend after the publication of the US Federal Reserve’s decision to cut the interest rate by 50 basis points, which marked the beginning of the easing cycle of monetary policy. Against this background, investor interest in assets alternative to the dollar grew significantly, acting as a driver for strengthening the stock and cryptocurrency markets, and particularly the ETH price tested the 2700.00 mark.
Experts note that interest in Ethereum-based futures also increased on September 19 by 4.66 million ETH, which was a record figure since January 2023. However, the potential for further upward dynamics seems limited: despite the increase in the volume of active futures contracts, the premium for them remains at a consistently low level of 6.0%. At the same time, the outflow of funds from spot Ethereum-ETFs last week amounted to 26.2 million dollars, confirming the likelihood of a correction in the medium term.
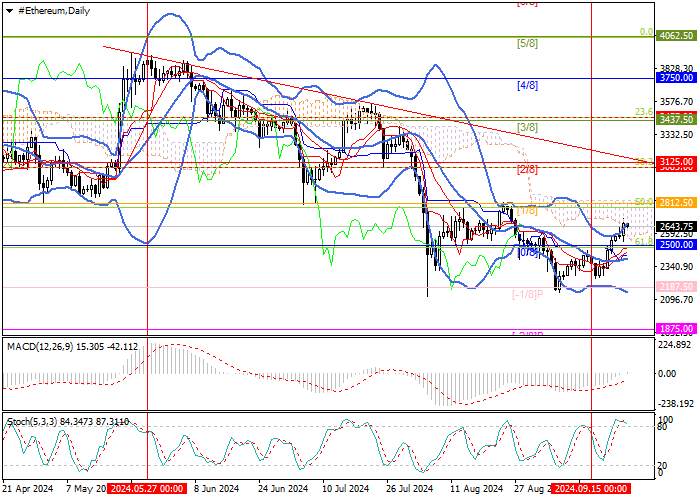
Support and resistance
The price has consolidated above the 2500.00 mark (Murrey level [0/8], 61.8%Fibonacci retracement) and is heading towards the 2812.50 level (Murrey level [1/8], 50.0% Fibonacci retracement), which it has already unsuccessfully tested last month. If it is broken out, the growth will be able to continue to the levels of 3125.00 (Murrey level [2/8]) and 3437.50 (Murrey level [1/8], 23.6% Fibonacci retracement). Otherwise, the price will be able to return to the 2187.50 mark (Murrey level [˗1/8]) or fall to the level of 1875.00 (Murrey level [˗2/8]).
Technical indicators do not give a clear signal: Bollinger Bands are reversing up, but Stochastic is preparing to leave the overbought zone, and MACD may soon move into the positive zone. However, it is worth considering that the long-term downtrend in the ETH/USD pair remains, increasing the likelihood of a resumption of the downward movement.
Resistance levels: 2812.50, 3125.00, 3437.50.
Support levels: 2500.00, 2187.50, 1875.00.

Trading tips
Short positions can be opened below the 2500.00 mark or after the price reversal around 2812.50 with targets at 2187.50, 1875.00 and stop-losses at 2700.00 and 3000.00, respectively. Implementation period: 5–7 days.
风险提示:以上内容仅代表作者或嘉宾的观点,不代表 FOLLOWME 的任何观点及立场,且不代表 FOLLOWME 同意其说法或描述,也不构成任何投资建议。对于访问者根据 FOLLOWME 社区提供的信息所做出的一切行为,除非另有明确的书面承诺文件,否则本社区不承担任何形式的责任。
FOLLOWME 交易社区网址: followme.asia


加载失败()