| Scenario | |
|---|---|
| Timeframe | Weekly |
| Recommendation | BUY STOP |
| Entry Point | 158.00 |
| Take Profit | 175.00, 187.50 |
| Stop Loss | 150.00 |
| Key Levels | 110.80, 125.00, 137.50, 157.40, 175.00, 187.50 |
| Alternative scenario | |
|---|---|
| Recommendation | SELL STOP |
| Entry Point | 137.00 |
| Take Profit | 125.00, 110.80 |
| Stop Loss | 146.00 |
| Key Levels | 110.80, 125.00, 137.50, 157.40, 175.00, 187.50 |
Current trend
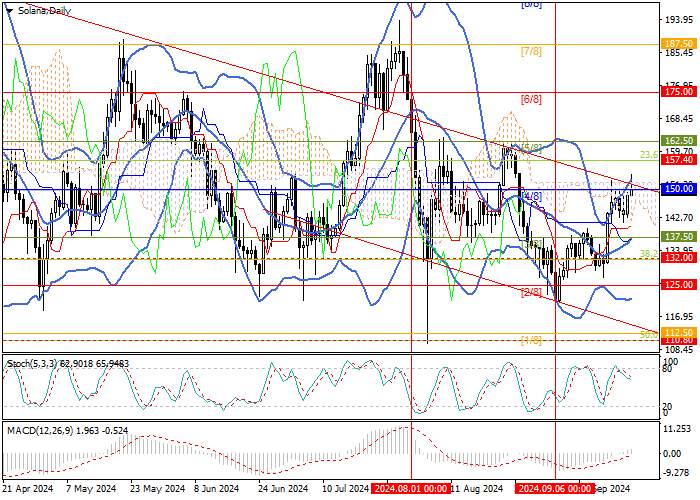
The SOL/USD pair continues to move within the descending channel for the second month in a row: now, quotes have started to grow and are testing its upper limit around the 150.00 mark (Murrey level [4/8]), if fixed above which and the 157.40 mark (23.6% Fibonacci retracement), the movement will continue to the targets of 175.00 (Murrey level [6/8]) and 187.50 (Murrey level [7/8]). The level of 137.50 (Murrey level [3/8]) seems to be the key for the “bears” 137.50 level (Murrey level [3/8]), supported by the central line of Bollinger Bands: its breakdown will allow testing the 125.00 (Murrey level [2/8]) and 110.80 (50.0% Fibonacci retracement) marks.
Technical indicators confirm the formation of a new uptrend on the market: Bollinger Bands are reversing up, MACD is increasing in the positive zone, but Stochastic has reversed down from the overbought zone, not excluding price consolidation in the 150.00 area. The exit of quotes from the medium-term downward channel and the beginning of growth in the near future seems to be a quite probable scenario.
Support and resistance
Resistance levels: 157.40, 175.00, 187.50.
Support levels: 137.50, 125.00, 110.80.

Trading tips
Long positions can be opened above 157.40 with targets at 175.00, 187.50 and a stop-loss at 150.00. Implementation period: 5–7 days.
Short positions can be opened below the 137.50 mark with targets at 125.00, 110.80 and a stop-loss at 146.00.
风险提示:以上内容仅代表作者或嘉宾的观点,不代表 FOLLOWME 的任何观点及立场,且不代表 FOLLOWME 同意其说法或描述,也不构成任何投资建议。对于访问者根据 FOLLOWME 社区提供的信息所做出的一切行为,除非另有明确的书面承诺文件,否则本社区不承担任何形式的责任。
FOLLOWME 交易社区网址: followme.asia


加载失败()