| Scenario | |
|---|---|
| Timeframe | Weekly |
| Recommendation | BUY STOP |
| Entry Point | 0.6400 |
| Take Profit | 0.6836, 0.7324 |
| Stop Loss | 0.6020 |
| Key Levels | 0.3906, 0.4395, 0.5020, 0.6348, 0.6836, 0.7324 |
| Alternative scenario | |
|---|---|
| Recommendation | SELL STOP |
| Entry Point | 0.5000 |
| Take Profit | 0.4395, 0.3906 |
| Stop Loss | 0.5400 |
| Key Levels | 0.3906, 0.4395, 0.5020, 0.6348, 0.6836, 0.7324 |
Current trend
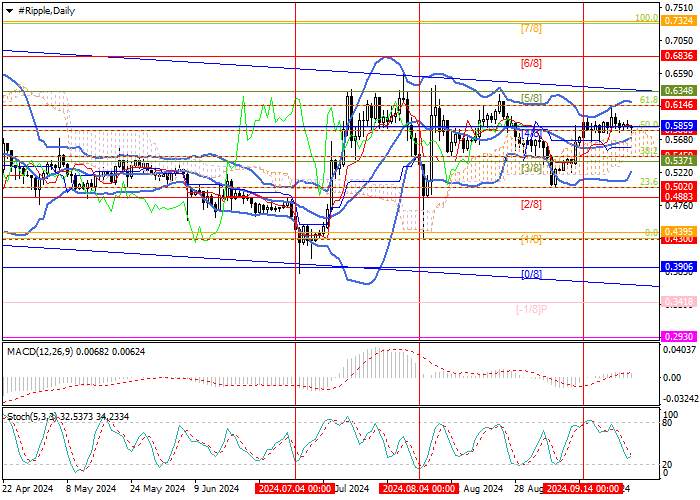
The XRP/USD pair has formed a new sideways range of 0.6146–0.5020 (61.8%–23.6% Fibonacci retracement), within which it has been for several months. Over the past two weeks, quotes have stabilized at 0.5859 (Murrey level [4/8], 50.0% Fibonacci retracement) in anticipation of new significant drivers of movement.
The key resistance zone for the “bulls” seems to be 0.6146–0.6348 (61.8% Fibonacci retracement–Murrey level [5/8]), if it’s broken out, growth will be able to resume to the targets of 0.6836 (Murrey level [6/8]), 0.7324 (Murrey level [7/8]). The price consolidation below the lower boundary of the sideways range of 0.5020 (23.6% Fibonacci retracement) will ensure a decline to the levels of 0.4395 (Murray level [1/8]), 0.3906 (Murrey level [0/8], the area of the July lows).
Technical indicators allow for continued growth attempts of the XRP/USD pair in the near future: Bollinger Bands and Stochastic are reversing up, and MACD is stable in the positive zone.
Support and resistance
Resistance levels: 0.6348, 0.6836, 0.7324.
Support levels: 0.5020, 0.4395, 0.3906.

Trading tips
Long positions can be opened above the level of 0.6348 with targets of 0.6836, 0.7324 and stop-loss around 0.6020. Implementation period: 5–7 days.
Short positions can be opened below the 0.5020 mark with targets of 0.4395, 0.3906 and stop-loss around 0.5400.
风险提示:以上内容仅代表作者或嘉宾的观点,不代表 FOLLOWME 的任何观点及立场,且不代表 FOLLOWME 同意其说法或描述,也不构成任何投资建议。对于访问者根据 FOLLOWME 社区提供的信息所做出的一切行为,除非另有明确的书面承诺文件,否则本社区不承担任何形式的责任。
FOLLOWME 交易社区网址: followme.asia


加载失败()