| Scenario | |
|---|---|
| Timeframe | Weekly |
| Recommendation | BUY |
| Entry Point | 67.40 |
| Take Profit | 72.75 |
| Stop Loss | 66.85 |
| Key Levels | 64.00, 68.27, 72.75, 76.70, 80.00 |
| Alternative scenario | |
|---|---|
| Recommendation | SELL STOP |
| Entry Point | 66.80 |
| Take Profit | 64.00 |
| Stop Loss | 68.25 |
| Key Levels | 64.00, 68.27, 72.75, 76.70, 80.00 |
Current trend
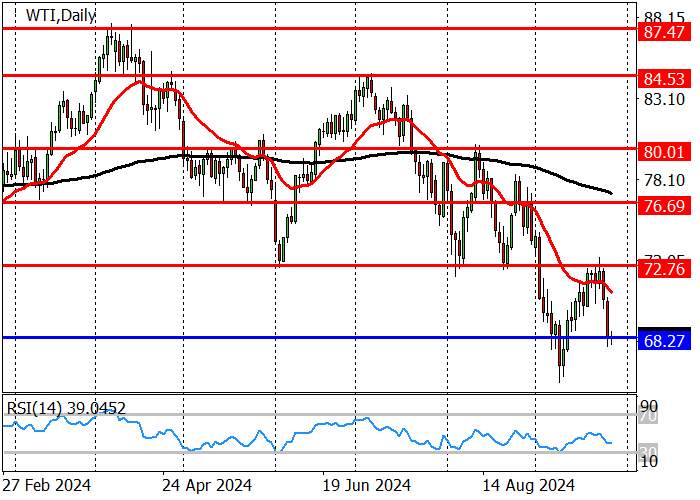
This week, WTI Crude Oil fell sharply to 68.27 after reports that Saudi Arabia was ready to abandon its unofficial 100.0 dollars per barrel target to regain market share.
In particular, the kingdom’s authorities are preparing to increase production for the first time in two years, even if this leads to a long period of low energy prices. Recall that Saudi Arabia has adjusted production by –2.0M barrels per day during this time, which amounted to more than a third of the total volume of cuts by OPEC member countries, and is currently producing 8.9M barrels of oil per day – a low since 2011. Earlier, the country’s authorities noted concerns that some alliance members were not complying with production-cut agreements and were ready to revise their plans if the situation did not change. This decision raises concerns among investors that they are unlikely to see prices close to 100.0 dollars per barrel soon, which is a driver for WTI Crude Oil sell-offs.
The oil market continues to correct, and according to the latest report from the US Commodity Futures Trading Commission (CFTC), last week, the number of net speculative positions in WTI Crude Oil increased from 140.0K to 145.3K. As for the dynamics, the significant reduction in positions in the previous two weeks was offset by the outflow of investor capital. Thus, the balance of “bulls” among producers was 357.693K against 309.592K among “bears”. Last week, buyers liquidated 10.013K contracts, while sellers increased their number by 8.479K transactions.
The trading instrument is moving in a long-term downward trend, having broken through the support level of 68.27 in September and renewed the year’s low of 65.50, after which it recovered to the resistance level of 72.75. It could not break through the resistance level, as a result of which sellers took advantage of the situation and lowered the price to the support level of 68.27, after breaking through which the 2023 low of 64.00 may be reached. Maintaining the support level of 68.27 will allow the asset to reach the resistance level of 72.75. To reverse the long-term trend, market participants need to test the 72.75 mark and consolidate above. In this case, a technical analysis pattern 1–2–3 will be formed, and the instrument may grow to 76.70 and 80.00.
The medium-term trend is downward. Last week, market participants reached the trend resistance area of 72.05–71.45 within an upward correction. Sellers held the zone but the price tested 68.78 and went to 65.60. If the asset recovers to 68.78, the probability of crossing the trend border will increase significantly, and the trend will reverse upwards.
Support and resistance
Resistance levels: 72.75, 76.70, 80.00.
Support levels: 68.27, 64.00.


Trading tips
Long positions may be opened from 68.25, with the target at 72.75 and stop loss 66.85. Implementation period: 9–12 days.
Short positions may be opened below 66.85, with the target at 64.00 and stop loss 68.25.
风险提示:以上内容仅代表作者或嘉宾的观点,不代表 FOLLOWME 的任何观点及立场,且不代表 FOLLOWME 同意其说法或描述,也不构成任何投资建议。对于访问者根据 FOLLOWME 社区提供的信息所做出的一切行为,除非另有明确的书面承诺文件,否则本社区不承担任何形式的责任。
FOLLOWME 交易社区网址: followme.asia


加载失败()