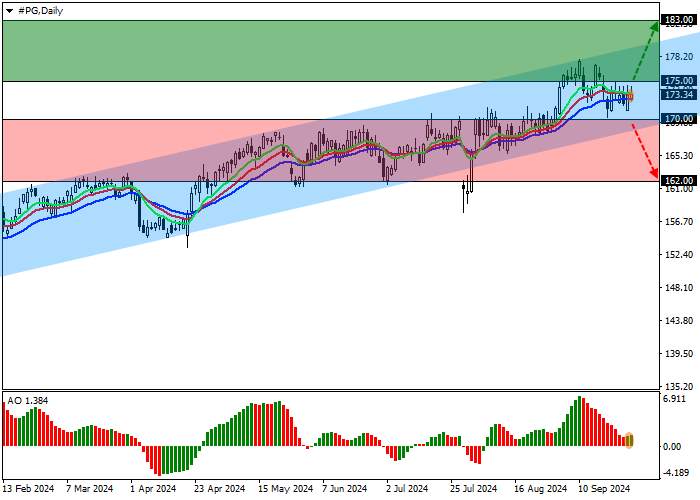
The shares of The Procter & Gamble Co., one of the leaders in the consumer goods market, are trading in a correction trend at 173.00.
On the daily chart, the price is moving within an ascending channel with dynamic boundaries of 180.00–169.00, retreating from the year’s high.
On the four-hour chart, the quotes can reach the nearest high of 177.00. After reaching the range’s resistance line of 180.00, it may reach the target of 183.00. However, the development of negative dynamics may follow as the price is close to the decline marker of 170.00.
Technical indicators maintain a buy signal: fast EMAs on the Alligator indicator are above the signal line, and the AO histogram has formed an ascending bar above the transition level.
Trading tips
Long positions may be opened after the price rises and consolidates above 175.00 183.00. Stop loss is 172.00. Implementation period: 7 days or more.
Short positions may be opened after the price falls and consolidates below 170.00, with the target at 162.00. Stop loss is 174.00.


加载失败()