| Scenario | |
|---|---|
| Timeframe | Weekly |
| Recommendation | BUY STOP |
| Entry Point | 157.50 |
| Take Profit | 175.00, 187.50 |
| Stop Loss | 157.00 |
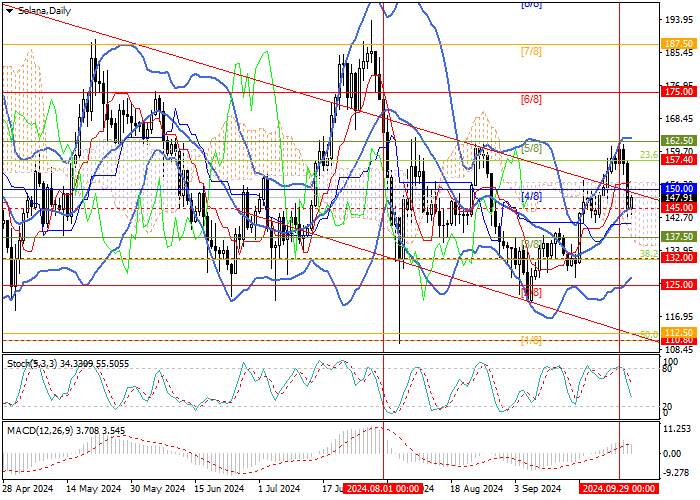
| Key Levels | 110.80, 125.00, 137.50, 157.40, 175.00, 187.50 |
| Alternative scenario | |
|---|---|
| Recommendation | SELL STOP |
| Entry Point | 137.50 |
| Take Profit | 125.00, 110.80 |
| Stop Loss | 145.50 |
| Key Levels | 110.80, 125.00, 137.50, 157.40, 175.00, 187.50 |
Current trend
The SOL/USD pair has been actively adding value over the past three weeks, but yesterday the price adjusted to the area of 145.00 (the central line of Bollinger Bands) as part of a general market trend.
The reason for the weakening of the leading cryptocurrencies was the aggravation of the situation in the Middle East, which led to a decrease in investor interest in risky assets, including digital ones: for example, Bitcoin-ETFs lost 242.6 million dollars yesterday (the largest outflow since early September), and Etherium-ETFs – 48.6 million dollars. Nevertheless, most experts note that such dynamics have been observed more than once against the background of the escalation of the Middle East conflict, in particular, in April of this year and last autumn, but quotes recovered quite quickly. Probably, such a scenario will be implemented now, also with the aid of the active development of the Solana network: over the past month, investor interest in this blockchain has grown significantly due to the launch of a new service for game development Gameshift API, jointly created by Solana Labs and Google Cloud and allowing to combine Web2 and Web3 technologies, as well as against the presentation of the new smartphone Solana Seerker, which is a continuation of the Saga series of gadgets with an updated store of decentralized applications (DApps).
Thus, despite the current price correction, the prerequisites for the recovery of the growth of the SOL/USD pair remain.
Support and resistance
Technically, the price is trying to resume growth from the central line of Bollinger Bands (145.00). After the breakout of the 157.40 mark (23.6% Fibonacci retracement), it may continue to the targets of 175.00 (Murrey level [6/8]) and 187.50 (Murrey level [7/8]). A breakdown of the level of 137.50 (Murrey level [3/8]) will open the possibility for the development of a downtrend towards the targets of 125.00 (Murrey level [2/8]) and 110.80 (50.0% Fibonacci retracement).
Technical indicators do not give a clear signal: Bollinger Bands reverse up and the Stochastic reverses down, while MACD decreases but remains in the positive zone.
Resistance levels: 157.40, 175.00, 187.50.
Support levels: 137.50, 125.00, 110.80.

Trading tips
Long positions can be opened above the 157.40 mark with targets of 175.00, 187.50 and a stop-loss around 157.00. Implementation period: 5–7 days.
Short positions can be opened from the level of 137.50 with targets of 125.00, 110.80 and a stop
风险提示:以上内容仅代表作者或嘉宾的观点,不代表 FOLLOWME 的任何观点及立场,且不代表 FOLLOWME 同意其说法或描述,也不构成任何投资建议。对于访问者根据 FOLLOWME 社区提供的信息所做出的一切行为,除非另有明确的书面承诺文件,否则本社区不承担任何形式的责任。
FOLLOWME 交易社区网址: followme.asia


加载失败()