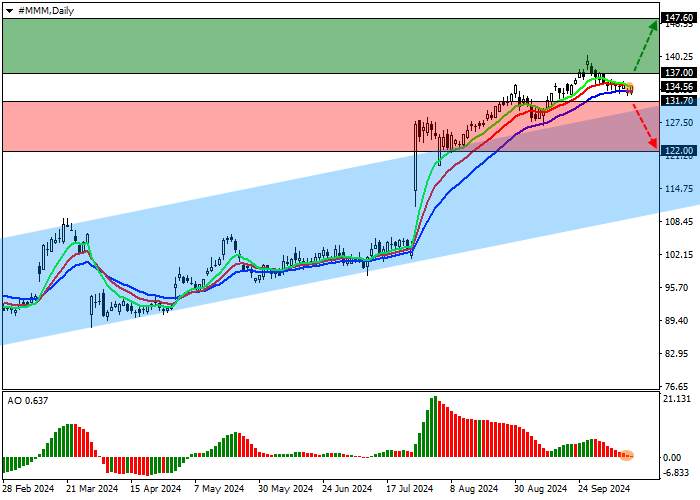
Shares of 3M Co., an American diversified innovation and manufacturing company, are trading within an uptrend at 135.00.
On the daily chart, the price is moving above the resistance line of the ascending channel with dynamic boundaries of 132.00–108.00.
On the four-hour chart, the quotes left the range. After another attempt to return to it and testing the resistance line 131.00, the probability of further growth increases. After a breakout of the high of 138.00, the price may reach 147.00.
Technical indicators maintain an unstable buy signal: fast EMAs on the Alligator indicator are above the signal line, maintaining a narrow range of fluctuations, and the AO histogram forms correction bars in the buy zone.
Trading tips
Long positions may be opened after the price rises and consolidates above 137.00, with the target at 147.60. Stop loss is 134.00. Implementation period: 7 days or more.
Short positions may be opened after the price falls and consolidates below 131.70, with the target at 122.00. Stop loss is 135.00.


加载失败()