| Scenario | |
|---|---|
| Timeframe | Intraday |
| Recommendation | BUY STOP |
| Entry Point | 2670.05 |
| Take Profit | 2700.00 |
| Stop Loss | 2655.00 |
| Key Levels | 2613.83, 2623.84, 2640.00, 2655.00, 2670.00, 2685.56, 2700.00, 2720.00 |
| Alternative scenario | |
|---|---|
| Recommendation | SELL STOP |
| Entry Point | 2654.95 |
| Take Profit | 2623.84 |
| Stop Loss | 2670.00 |
| Key Levels | 2613.83, 2623.84, 2640.00, 2655.00, 2670.00, 2685.56, 2700.00, 2720.00 |
Current trend
The XAU/USD pair is showing moderate growth, developing the "bullish" momentum formed once again at the end of last week, when the instrument managed to retreat from its local lows of September 20. Gold is testing 2660.00 for a breakout, receiving support from expectations of monetary easing by global financial regulators. In particular, on Thursday, October 17, the European Central Bank (ECB) is expected to cut the interest rate by 25 basis points. Investors are counting on another reduction in the indicator from the US Federal Reserve in November. At the same time, analysts have practically abandoned the idea of adjusting the rate immediately by –50 basis points against the backdrop of statements by the Chair of the Fed, Jerome Powell, as well as macroeconomic statistics on inflation published at the end of last week.
In September, the Consumer Price Index slowed down in annual terms from 2.5% to 2.4%, with a forecast of 2.3%, and in monthly terms it remained at 0.2%, while experts expected 0.1%. The Core CPI excluding Food and Energy adjusted from 3.2% to 3.3% year-on-year and added 0.3% month-on-month. In turn, the Producer Price Index in annual terms fell from 1.9% to 1.8% with expectations of 1.6%, and in monthly terms — from 0.2% to 0.0% with preliminary estimates of 0.1%, while the PPI excluding Food and Energy rose from 2.6% to 2.8% with a forecast of 2.7%. Separately, market participants drew attention to the decline in the Consumer Confidence index from the University of Michigan in October from 70.1 points to 68.9 points, while analysts expected the indicator to rise to 70.8 points.
Additionally, gold is supported by ongoing geopolitical risks, which are only intensifying as uncertainty around the US presidential election in November grows.
Support and resistance
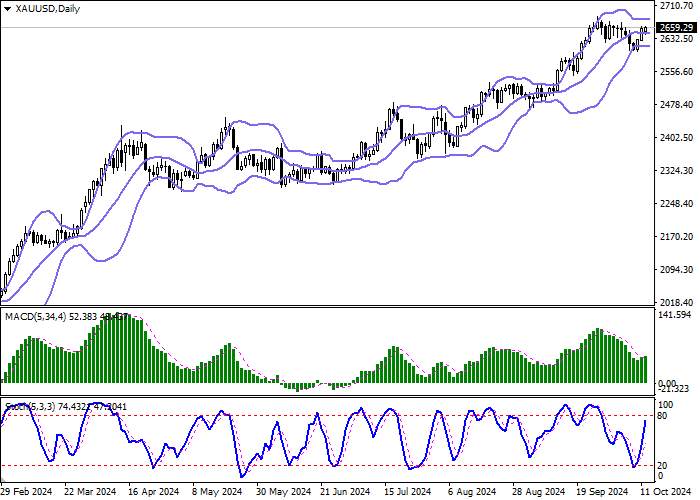
Bollinger Bands on the daily chart demonstrate flat dynamics. The price range is almost constant, remaining rather spacious for the current level of activity on the market. MACD indicator reverses to growth while forming a new buy signal (the histogram is about to consolidate above the signal line). Stochastic, in turn, shows a sharp increase and is already located in close proximity to its highs, indicating the risks of the instrument being overbought in the ultra-short term.
Resistance levels: 2670.00, 2685.56, 2700.00, 2720.00.
Support levels: 2655.00, 2640.00, 2623.84, 2613.83.


Trading tips
Long positions can be opened after a breakout of 2670.00 with the target of 2700.00. Stop-loss — 2655.00. Implementation time: 1-2 days.
A rebound from 2670.00 as from resistance, followed by a breakdown of 2655.00 may become a signal for opening of new short positions with the target at 2623.84. Stop-loss — 2670.00.
风险提示:以上内容仅代表作者或嘉宾的观点,不代表 FOLLOWME 的任何观点及立场,且不代表 FOLLOWME 同意其说法或描述,也不构成任何投资建议。对于访问者根据 FOLLOWME 社区提供的信息所做出的一切行为,除非另有明确的书面承诺文件,否则本社区不承担任何形式的责任。
FOLLOWME 交易社区网址: followme.asia


加载失败()