| Scenario | |
|---|---|
| Timeframe | Intraday |
| Recommendation | SELL STOP |
| Entry Point | 1.3860 |
| Take Profit | 1.3765 |
| Stop Loss | 1.3908 |
| Key Levels | 1.3765, 1.3800, 1.3838, 1.3862, 1.3908, 1.3958, 1.4000, 1.4050 |
| Alternative scenario | |
|---|---|
| Recommendation | BUY STOP |
| Entry Point | 1.3910 |
| Take Profit | 1.4000 |
| Stop Loss | 1.3862 |
| Key Levels | 1.3765, 1.3800, 1.3838, 1.3862, 1.3908, 1.3958, 1.4000, 1.4050 |
Current trend
During the morning session, the USD/CAD pair is actively declining, leveling out the results of yesterday’s rapid upward dynamics, and is testing the 1.3890 mark for a breakdown amid expectations of the US Fed interest rate cut.
Today at 21:00 (GMT 2), the results of the regulator’s meeting are due. Analysts expect an interest rate change by –25 basis points to 4.75% and an indication of the possibility of another reduction in December. Meanwhile, investors are assessing the outcome of the US presidential election and its impact on the US Fed’s future actions. A tougher trade policy may be implemented after the Republican representative Donald Trump comes to power, including a significant increase in import duties on goods from the EU and China. As a result, the US Fed may abandon its “dovish” rhetoric, especially in comparison with the European Central Bank (ECB) or the Bank of England.
On October 23, the Bank of Canada cut its interest rate for the fourth time, bringing it to 3.75%. In the accompanying statement, officials expressed concern that the most significant reduction in the indicator in the last 15 years could be interpreted by the market as a sign of economic problems, leading to expectations of further steps of the same scale or expectations of the monetary policy’s extreme flexibility. Macroeconomic statistics put additional pressure on the Canadian currency. The October Ivey Business School PMI fell from 53.1 points to 52.0 points against the forecast of 54.2 points, while the US Institute for Supply Management (ISM) service PMI changed from 54.9 points to 56.0 points, although experts expected 53.8 points.
Support and resistance
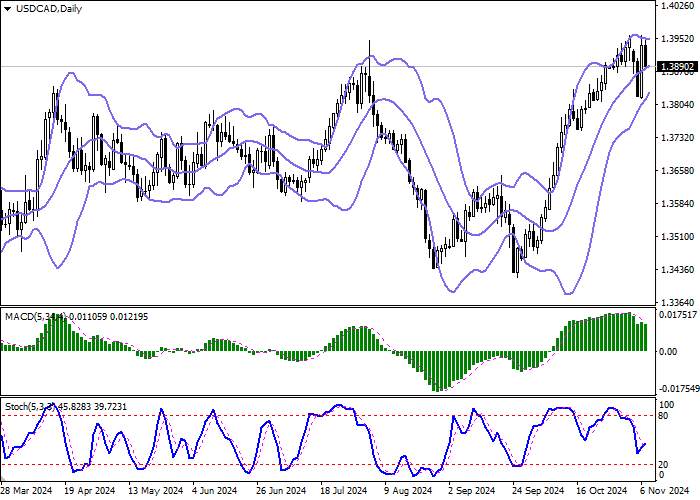
On the daily chart, Bollinger bands are growing steadily. The price range is narrowing, reflecting the ambiguous nature of trading in recent days. The MACD indicator is declining, maintaining a poor sell signal (the histogram is below the signal line). Stochastic, on the contrary, is rising, barely reacting to the “bearish” attempts.
Resistance levels: 1.3908, 1.3958, 1.4000, 1.4050.
Support levels: 1.3862, 1.3838, 1.3800, 1.3765.


Trading tips
Short positions may be opened after a breakdown of 1.3862 with the target at 1.3765. Stop loss — 1.3908. Implementation period: 2–3 days.
Long positions may be opened after a rebound from 1.3862 and a breakout of 1.3908, with the target at 1.4000. Stop loss — 1.3862.
风险提示:以上内容仅代表作者或嘉宾的观点,不代表 FOLLOWME 的任何观点及立场,且不代表 FOLLOWME 同意其说法或描述,也不构成任何投资建议。对于访问者根据 FOLLOWME 社区提供的信息所做出的一切行为,除非另有明确的书面承诺文件,否则本社区不承担任何形式的责任。
FOLLOWME 交易社区网址: followme.asia


加载失败()