Fibonacci Retracement is an extremely popular tool among traders. In fact, it's so popular that almost no trader is unfamiliar with this tool.
Fibonacci Retracement is one of many analysis tools available by default on various trading platforms. Its popularity is primarily due to its frequent discussion by many traders through their social media content and its consistent presence in technical analysis books. Additionally, its relatively simple usage makes it easy for many traders to understand, attracting many to incorporate this tool into their trading.
Unfortunately, the impact of Fibonacci retracement's popularity cannot be considered positive. Fibonacci retracement is often overvalued, as if it were an extraordinary tool with high accuracy and other remarkable qualities. However, most traders who initially use Fibonacci retracement end up abandoning it. This means that Fibonacci retracement doesn't work as they expected, leading them to choose not to use it anymore.
For some people, the extraordinary assessment of Fibonacci retracement seems reasonable enough. Many believe that Fibonacci retracement is based on logical theory simply because its name refers to the Fibonacci sequence or because its levels use the golden ratio. In reality, Fibonacci Retracement has no theoretical foundation, let alone a mathematical formula.
While the naming does come from the Fibonacci sequence, there are no actual Fibonacci sequence elements present. Even the levels using golden ratio values are not essentially derived through proper calculations. As we know, the golden ratio is related to Fibonacci because these ratios can be produced by dividing two consecutive numbers in the Fibonacci sequence. The golden ratio in Fibonacci retracement levels is merely like a label that can be attached and detached without any consideration. We could replace it with any number since no specific formula is needed to generate these numbers.
When compared to technical indicators, it becomes very clear that Fibonacci retracement is too simple, contrary to how it has been placed on such a high pedestal by most traders. Fibonacci retracement has no parameters other than levels that can be easily replaced. Its usage also depends on how traders view swing highs and swing lows. In other words, Fibonacci is too subjective for a tool that is supposedly relied upon heavily for market analysis. While technical indicators can produce the same signals for everyone, Fibonacci retracement heavily depends on the perception of the person using it.
However, this doesn't mean that Fibonacci retracement cannot be used at all. Fibonacci Retracement remains useful as long as it's used proportionally.
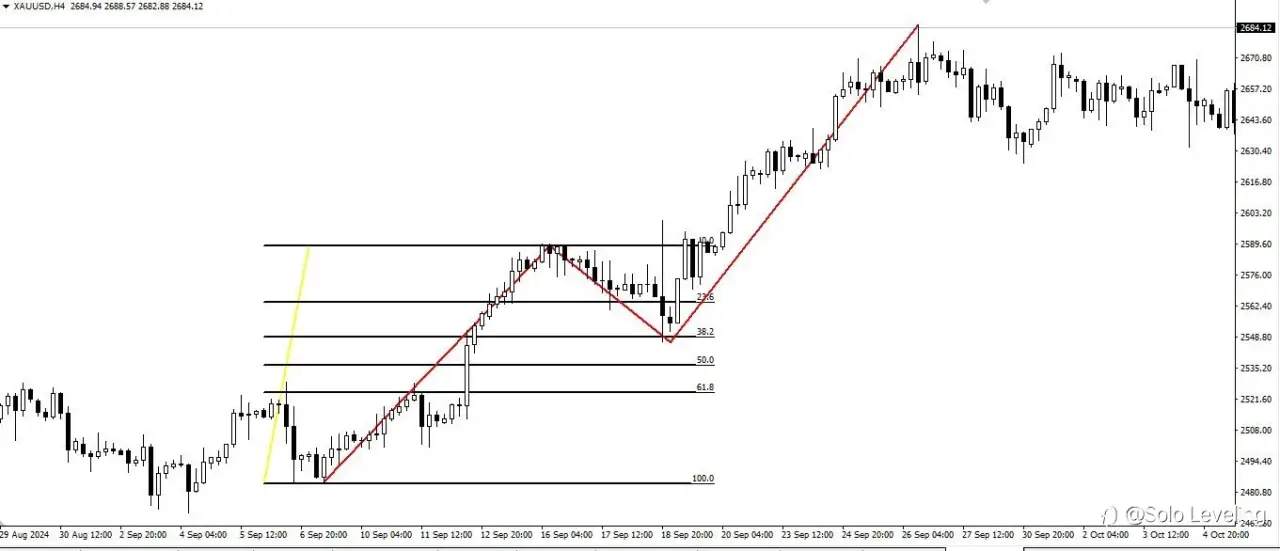
Essentially, Fibonacci retracement is a measuring tool to see how far a correction movement occurs in a market. Like measuring tools in general, to use Fibonacci retracement, the object being measured—price correction—must form first. Of course, we can place Fibonacci before a correction occurs because the reference for drawing Fibonacci is the previous swing high and swing low. However, we cannot conclude that a correction will end at a certain level of the Fibonacci retracement we've placed. The correction must actually be completed before we can see how far it has occurred.
"So it's useless then? Traders need to predict market movements, not confirm them!"
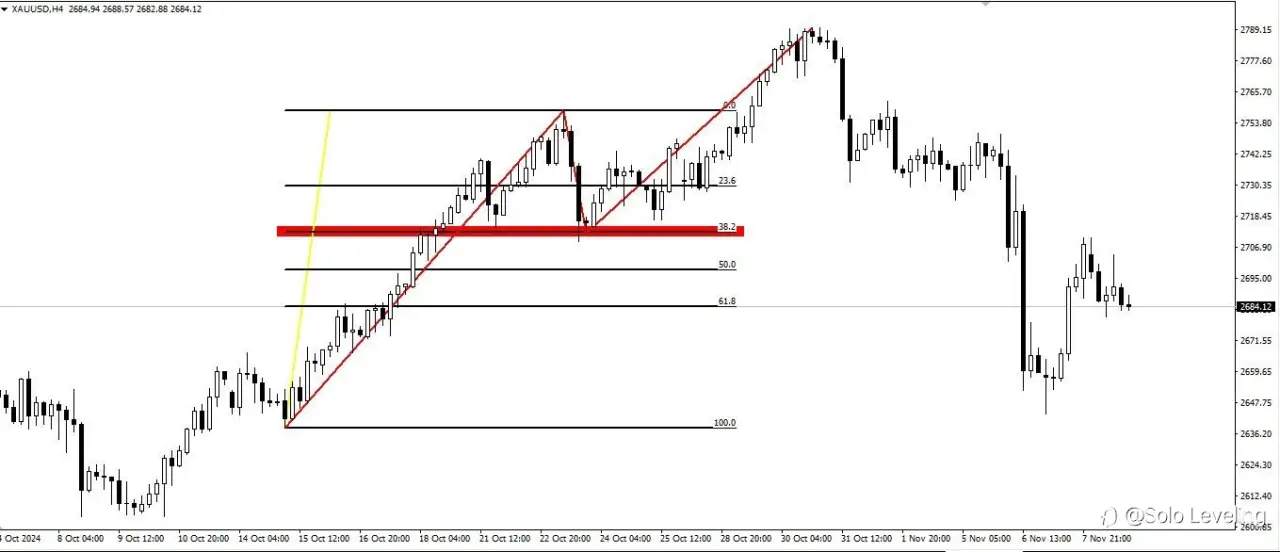
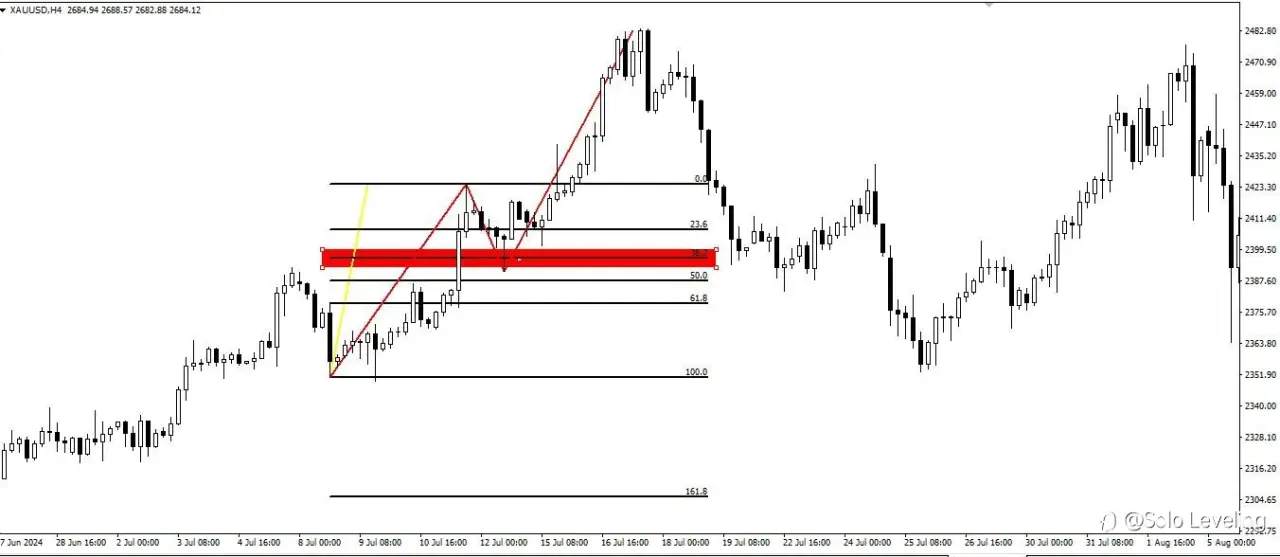
Hold on, who says it's useless? After we know that a correction in a market stops at, say, the 38.2 Fibonacci retracement level, we can use this to examine whether other corrections in the past also moved within the same range. How many corrections stopped at the 38.2 Fibonacci level in the past, and how many stopped before or after the 38.2 level? If we find that there are quite a few corrections that stopped at the 38.2 level and most truly ended with trend continuation, then we have discovered a pattern or habit of that market. Now, we can use this habit to make trading decisions when we face correcting market conditions in the future.
So, while not as remarkable as people claim, Fibonacci retracement remains useful. This tool can help us specifically capture market habits, particularly during corrective phases. As its name suggests—fibonacci retracement—implying that this tool has elements of the Fibonacci sequence, in this case the golden ratio (albeit just as labels), and is specifically functioned for markets experiencing corrections or retracements.
Additionally, thanks to its levels that can be modified as we wish, Fibonacci can become a substitute tool for determining SL and TP based on risk-to-reward ratio when we trade. Because Fibonacci not only has internal levels consisting of levels 0 to 1, but also has external levels starting from 1.1 to any number. These external levels can function the same as internal levels, namely to measure price movements, more specifically to measure the impulsive movements of a market trend. In different terms, people often refer to it as external correction—if you're not familiar with the term impulsive movement, you might understand if I call it external correction, a correction but in the direction of the trend, quite amusing.
To use it as an SL and TP determiner, you just need to adjust the external level based on the risk and reward ratio we want to use. However, since using Fibonacci retracement requires two levels as reference points for drawing, we must at least know the entry point and either the SL or TP.
If we determine SL and entry first, then we use the external level as the TP level. This means level 1 is at the entry level and level 0 is at the SL level. And if we determine TP and entry first, then we use the external level as SL, by drawing Fibonacci from the entry level to the TP level.
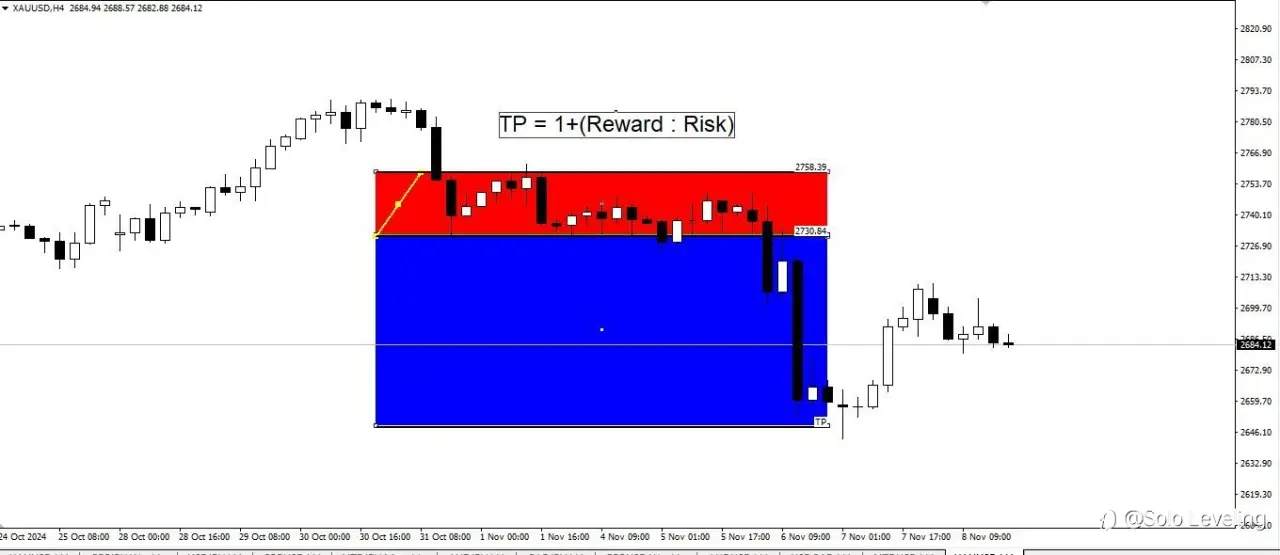
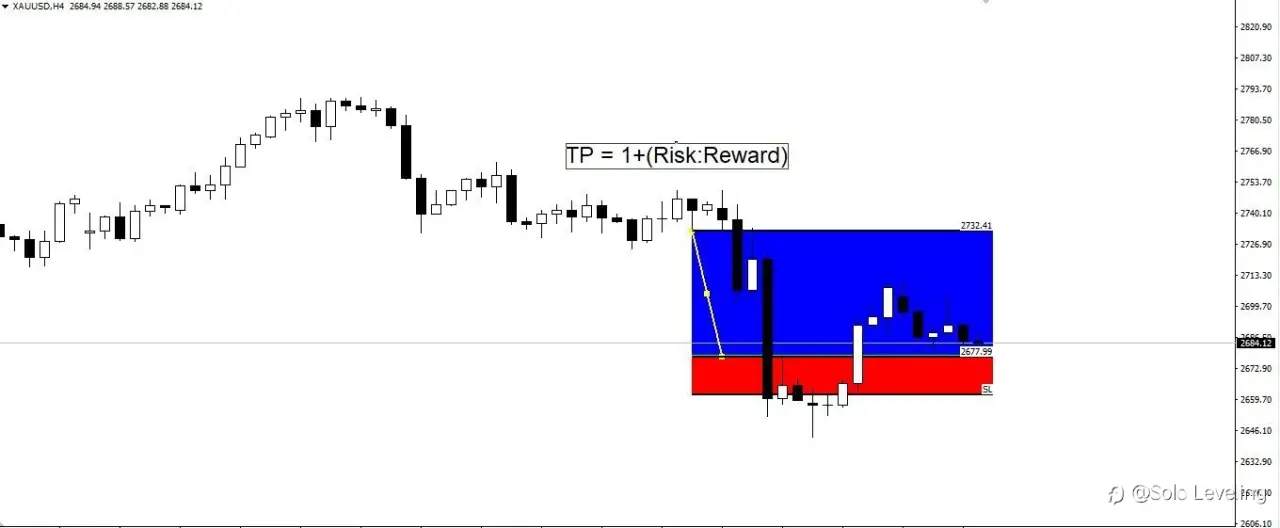
The adjustment of external levels as either SL or TP depends on the risk ratio we want to use. The formula for determining the external level for TP is 1 + (Reward : Risk). While for determining the external level SL is 1 + (Risk : Reward). For example, if the desired risk-reward ratio is 1:3, then the TP level is 1 + (3 : 1) = 4, while the SL level is 1 + (1 : 3) = 1.3.
In essence, Fibonacci retracement has long been used for the wrong purpose. Fibonacci retracement is not a technical indicator, so don't use it to predict market movements. We can use it to predict the market, but not as the primary method—rather as an additional tool. As in the previous example, we use it to identify patterns of correction movement habits. After we successfully find these patterns or habits, we can use them to predict the market. So we rely on market habits to make predictions, not on Fibonacci retracement.
Conversely, Fibonacci retracement is ideally used as a meter whose function relates to range or distance. Fibonacci retracement can be well utilized to measure the distance between the starting point of correction and the endpoint of correction, and can also be used to help us determine SL and TP levels.
已编辑 09 Nov 2024, 20:16
风险提示:以上内容仅代表作者或嘉宾的观点,不代表 FOLLOWME 的任何观点及立场,且不代表 FOLLOWME 同意其说法或描述,也不构成任何投资建议。对于访问者根据 FOLLOWME 社区提供的信息所做出的一切行为,除非另有明确的书面承诺文件,否则本社区不承担任何形式的责任。
FOLLOWME 交易社区网址: followme.asia


加载失败()