Shares of Verizon Communications Inc., one of America's largest telecommunications companies, are trading at $41.00.
On the daily chart, the price is moving in a correction trend, above the support line of the ascending channel 46.00–40.00.
On the four-hour chart, the closest resistance level is the high within the 42.00 channel. If broken through, the price will reach the yearly high around 45.00. The most likely scenario is a rise to the channel resistance level at 46.00. However, in case the asset consolidates below 40.00, a bearish change development may follow.
Technical indicators are actively delaying the sell signal: the fast EMA on the Alligator indicator is approaching the signal line, narrowing the range of volatility, and the AO histogram is forming support bars in the negative zone.
Trading Tips
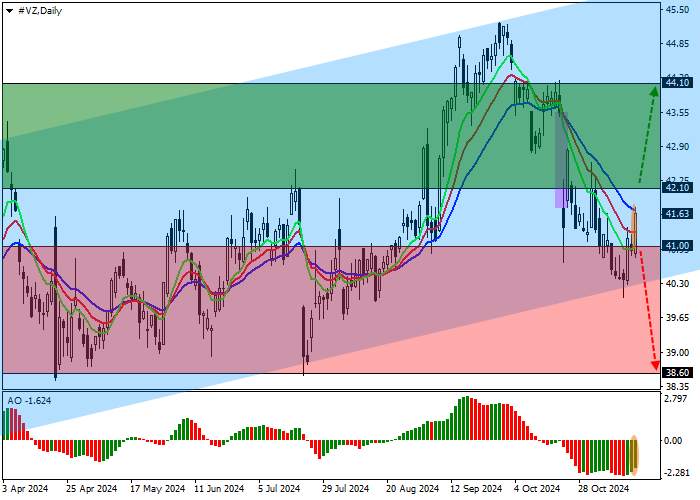
Long positions can be opened after the price increases and consolidates above 42.10 with a target at 44.10 and a stop loss at 41.30. Execution period: 7 days or more.
Short positions can be opened after the price drops and consolidates below 41.00 with a target at 38.60 and a stop loss at 42.00.


加载失败()