| Scenario | |
|---|---|
| Timeframe | Weekly |
| Recommendations | BUY STOP |
| Entry point | 100.05 |
| Take Profit | 103.12 |
| Stop Loss | 97.60 |
| Key levels | 90.62, 93.75, 96.88, 100.00, 101.56, 103.12 |
| Alternative scenario | |
|---|---|
| Recommendations | SELL STOP |
| Entry point | 96.85 |
| Take Profit | 93.75, 90.62 |
| Stop Loss | 98.90 |
| Key levels | 90.62, 93.75, 96.88, 100.00, 101.56, 103.12 |
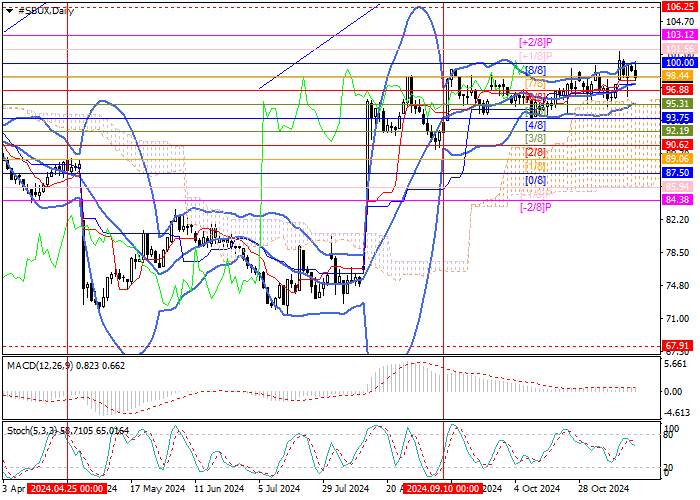
Current dynamics
Shares of Starbucks Corp., one of the largest companies that owns the coffee shop chain of the same name, have been trading in a sideways range of 93.75–100.00 (Murray level [4/8]–[8/8]) for the third month and have not been able to leave it yet: the price is currently testing the upper boundary of the channel and if it consolidates above it, it will continue to grow in the upper reversal zone to 103.12 (Murray level [ 2/8]). If the asset consolidates below the middle line of Bollinger Bands 96.88 (Murray level [6/8]), a decline to the area of 93.75 (Murray level [4/8]) and 90.62 (Murray level [2/8]) is expected.
Technical indicators do not give a single signal: Bollinger bands are turning up, the MACD histogram is stable in the positive zone, but Stochastic is turning down. It is worth considering that the long-term upward trend in the market remains, which increases the likelihood of renewed growth in quotes.
Support and resistance levels
Resistance levels: 100.00, 101.56, 103.12.
Support levels: 96.88, 93.75, 90.62.

Trading scenarios
Long positions can be opened above the level of 100.00 with a target of 103.12 and a stop-loss of 97.60. Implementation period: 5-7 days.
Short positions can be opened below the level of 96.88 with targets at 93.75, 90.62 and stop-loss at 98.90.
风险提示:以上内容仅代表作者或嘉宾的观点,不代表 FOLLOWME 的任何观点及立场,且不代表 FOLLOWME 同意其说法或描述,也不构成任何投资建议。对于访问者根据 FOLLOWME 社区提供的信息所做出的一切行为,除非另有明确的书面承诺文件,否则本社区不承担任何形式的责任。
FOLLOWME 交易社区网址: followme.asia


加载失败()