| Scenario | |
|---|---|
| Timeframe | Weekly |
| Recommendation | BUY STOP |
| Entry Point | 121.90 |
| Take Profit | 125.00, 128.12 |
| Stop Loss | 119.65 |
| Key Levels | 112.50, 115.62,121.88, 125.00, 128.12 |
| Alternative scenario | |
|---|---|
| Recommendation | BUY LIMIT |
| Entry Point | 115.62 |
| Take Profit | 125.00, 128.12 |
| Stop Loss | 113.60 |
| Key Levels | 112.50, 115.62,121.88, 125.00, 128.12 |
Current trend
Shares of ExxonMobil Corp., an American oil company, are trading within the framework of a long-term uptrend, but this week they adjusted down to the area of 118.00. Nevertheless, the current decline seems to be short-term, as fundamental factors contribute to the continuation of the uptrend.
So, US President-elect Donald Trump promised to promote the expansion of domestic production of "black gold". For these purposes, it is planned to increase trade tariffs, as well as increase the number of leased offshore drilling sites and stimulate the acceleration of issuing permits for the export of liquefied natural gas (LNG). The implementation of the plans is likely to lead to a significant increase in production volumes by American companies, however, according to the head of the exploration and production division of ExxonMobil Corp. Liam Mallon, it's going to take time. Speaking at the Energy Intelligence Forum 2025 in London, he noted that management plans to increase production from 3.7 million barrels of oil equivalent per day in 2023 to about 5.0 million barrels of oil equivalent per day by 2027.
A long-term negative factor for the emitter may be the decline in production in China and the slowdown in the global economy as a result of the "trade wars", however, experts hope that the incentives prepared by the new Republican administration will help ExxonMobil Corp. maintain profit growth.
Support and resistance
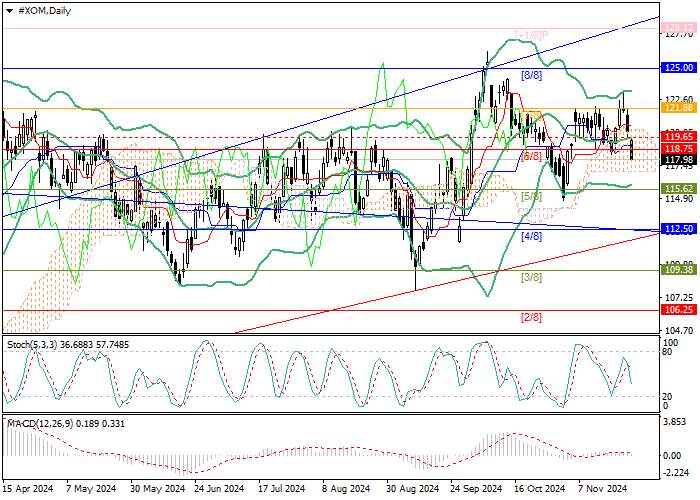
Technically, the price has fallen below the level of 118.75 (Murrey level [6/8]) and may continue to decline to the level of 115.62 (Murrey level [5/8], the lower line of Bollinger Bands). The key for the "bulls" is the level of 121.88 (Murrey level [7/8]), the breakout of which will ensure an intensification in upward dynamics to 125.00 (Murrey level [8/8]) and 128.12 (Murrey level [ 1/8]).
Technical indicators do not give a clear signal: Bollinger Bands are horizontal, MACD is stable in the negative zone, while Stochastic is pointing downwards.
Resistance levels: 121.88, 125.00, 128.12.
Support levels: 115.62, 112.50.

Trading tips
Long positions can be opened above 121.88 or after a price reversal around 115.62 with targets of 125.00, 128.12 and stop-losses around 119.65 and 113.60, respectively. Implementation period: 5–7 days.
风险提示:以上内容仅代表作者或嘉宾的观点,不代表 FOLLOWME 的任何观点及立场,且不代表 FOLLOWME 同意其说法或描述,也不构成任何投资建议。对于访问者根据 FOLLOWME 社区提供的信息所做出的一切行为,除非另有明确的书面承诺文件,否则本社区不承担任何形式的责任。
FOLLOWME 交易社区网址: followme.asia


加载失败()