| Scenario | |
|---|---|
| Timeframe | Weekly |
| Recommendations | SELL STOP |
| Entry point | 0.8300 |
| Take Profit | 0.8239 |
| Stop Loss | 0.8340 |
| Key levels | 0.8239, 0.8300, 0.8361, 0.8422, 0.8483 |
| Alternative scenario | |
|---|---|
| Recommendations | BUY STOP |
| Entry point | 0.8365 |
| Take Profit | 0.8422, 0.8483 |
| Stop Loss | 0.8320 |
| Key levels | 0.8239, 0.8300, 0.8361, 0.8422, 0.8483 |
Current dynamics
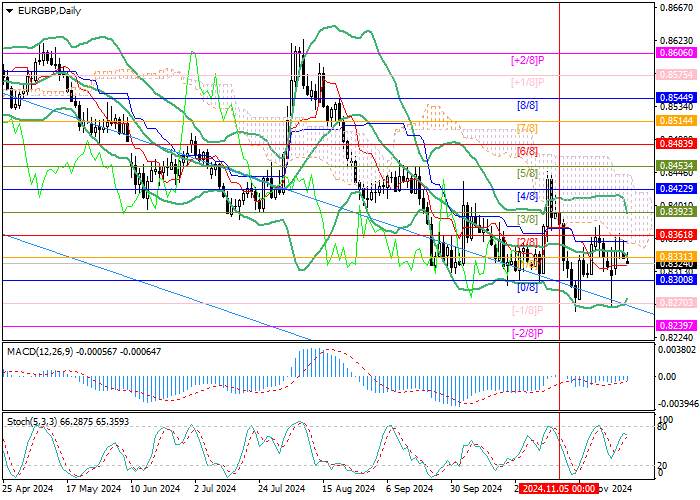
The EUR/GBP pair is trading within a long-term downtrend, having entered a sideways range of 0.8361–0.8270 (Murray levels [2/8]–[–1/8]) in November amid uncertainty about further actions by European and British regulators.
Currently, the economic situation of both countries seems similar: business activity is slowing down in all key sectors. Thus, in November, the composite business activity index in the UK fell to 49.9 points, and in the eurozone to 48.1 points as a result of fears of the start of “trade wars” after Donald Trump’s return to the White House. Additional pressure on British business is exerted by the state budget presented by the Labor government, which provides for a significant increase in taxes for enterprises. Inflationary pressure is also increasing, however, the consumer price index in the eurozone reached 2.0%, but met the target of the European Central Bank (ECB), and in the UK it was 2.3%, exceeding the levels required by the Bank of England.
In these conditions, the further steps of both regulators look uncertain, but most experts expect that both European and British officials will continue to gradually ease monetary policy, although its pace will be more significant in the eurozone. Analysts expect that the Bank of England will adjust the interest rate once a quarter in 2025, and in general over the year it will decrease by 100 basis points, and the ECB - by 150 basis points, which in the medium term will contribute to a further decline in the EUR/GBP pair.
Support and resistance levels
The trading instrument is close to the 0.8300 mark (Murray level [0/8]), consolidation below which will allow it to reach the target of 0.8239 (Murray level [–2/8]). In case of overcoming the 0.8361 mark (Murray level [2/8]), growth is expected to resume in the area of 0.8422 (Murray level [4/8]) and 0.8483 (Murray level [6/8]).
Technical indicators do not give a single signal: Bollinger Bands have moved horizontally, Stochastic is directed upward, and the MACD histogram is stable in the negative zone.
Resistance levels: 0.8361, 0.8422, 0.8483.
Support levels: 0.8300, 0.8239.

Trading scenarios
Short positions can be opened below the level of 0.8300 with a target of 0.8239 and a stop-loss of 0.8340. Implementation period: 5-7 days.
Long positions can be opened above the level of 0.8361 with targets at 0.8422, 0.8483 and stop loss at 0.8320.
风险提示:以上内容仅代表作者或嘉宾的观点,不代表 FOLLOWME 的任何观点及立场,且不代表 FOLLOWME 同意其说法或描述,也不构成任何投资建议。对于访问者根据 FOLLOWME 社区提供的信息所做出的一切行为,除非另有明确的书面承诺文件,否则本社区不承担任何形式的责任。
FOLLOWME 交易社区网址: followme.asia


加载失败()