| Scenario | |
|---|---|
| Timeframe | Weekly |
| Recommendations | BUY STOP |
| Entry point | 45300.0 |
| Take Profit | 46800.0 |
| Stop Loss | 45000.0 |
| Key levels | 43300.0, 44400.0, 45300.0, 46800.0 |
| Alternative scenario | |
|---|---|
| Recommendations | SELL STOP |
| Entry point | 44400.0 |
| Take Profit | 43300.0 |
| Stop Loss | 44800.0 |
| Key levels | 43300.0, 44400.0, 45300.0, 46800.0 |
Current dynamics
The Dow Jones index is correcting in an upward trend at 44864.0 amid the rhetoric of newly elected US President Donald Trump and the situation on the domestic bond market.
Thus, the new head of the White House demanded that the BRICS member countries abandon the idea of creating their own currency, otherwise they could face 100% tariffs on the export of their goods. Recall that at the summit in Kazan in October, the parties discussed plans to introduce a new global financial and payment system called BRICS Bridge, which is designed to "strike a blow at the dominance of the United States in global finance." In the short term, Donald Trump's rhetoric put pressure on the positions of the yuan and the ruble, while the dollar, on the contrary, accelerated its upward dynamics. However, this trend does not yet look strong, since market participants are expecting the publication of key data on the labor market at the end of the week, which will allow them to predict further steps by the American monetary authorities at the December meeting.
In turn, the rate on 10-year bonds fell to 4.403% from 4.437% recorded last week, and on 20-year bonds to 4.693% from 4.721%.
The growth leaders in the index are Nvidia Corp. ( 2.15%), The Boeing Co. ( 1.99%), and Honeywell International Inc. ( 1.43%).
Among the leaders of the decline were Merck & Company Inc. (-1.44%), Coca-Cola Co. (-0.54%), and Johnson & Johnson (-0.25%).
Support and resistance levels
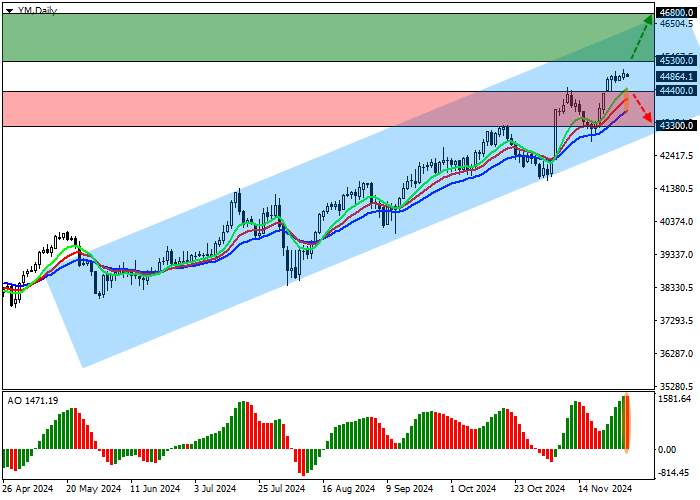
On the daily chart, the index quotes continue the corrective dynamics, trying to stay in close proximity to the resistance line of the ascending channel with boundaries of 46500.0–43000.0.
Technical indicators maintain a stable upward signal: the EMA oscillation range of the Alligator indicator is expanding, and the AO histogram is forming new correction bars, staying above the transition level.
Support levels: 44400.0, 43300.0.
Resistance levels: 45300.0, 46800.0.

Trading scenarios
If the asset continues to grow, buy positions will be relevant, which can be opened after overcoming the resistance level of 45300.0 with a target of 46800.0 and a stop loss of 45000.0. Implementation period: 7 days or more.
In case of a reversal and continuation of the decline, as well as consolidation of the price below the support level of 44400.0, sell positions with a target of 43300.0 will be relevant. Stop loss - 44800.0.
风险提示:以上内容仅代表作者或嘉宾的观点,不代表 FOLLOWME 的任何观点及立场,且不代表 FOLLOWME 同意其说法或描述,也不构成任何投资建议。对于访问者根据 FOLLOWME 社区提供的信息所做出的一切行为,除非另有明确的书面承诺文件,否则本社区不承担任何形式的责任。
FOLLOWME 交易社区网址: followme.asia


加载失败()