| Script | |
|---|---|
| Time frame | Intraday |
| Recommendation | SELL STOP |
| Entry point | 71.00 |
| Take Profit | 69.00 |
| Cut loss | 72.00 |
| Level of importance | 68.00, 69.00, 70.00, 71.00, 72.00, 73.00, 74.00, 75.24 |
| Other options | |
|---|---|
| Recommendation | BUY STOP |
| Entry point | 73.00 |
| Take Profit | 75.24 |
| Cut loss | 72.00 |
| Level of importance | 68.00, 69.00, 70.00, 71.00, 72.00, 73.00, 74.00, 75.24 |
Current trends
Brent Crude Oil prices are consolidating near 71.90 in the morning session: investors are taking a wait-and-see approach ahead of key US macroeconomic data and the OPEC meeting later in the week.
Analysts believe that at the meeting, a decision will be made to extend voluntary production cuts, although it was planned to return to the previous level of production in October. It is known that since the first quarter, eight countries in this organization, including Russia and Saudi Arabia, have reduced fuel production by 2.2 million barrels per day, however, experts believe that these measures are not enough to reverse the medium-term "bearish" trend if energy demand does not increase. Currently, oil prices are under pressure from the reduction of geopolitical tensions in the Middle East and the large-scale plan announced by US President-elect Donald Trump. The plan includes approving export licenses for new liquefied gas projects and increasing domestic production of "black gold". The market is currently in a state of oversupply, so any increase in production can unbalance the market.
On Friday at 15:30 (GMT 2), data on the US labor market for November will be released, which may moderate expectations for a new Fed rate cut at its December meeting on December 17–18. Current forecasts suggest that new non-farm payrolls will increase by 12.0 thousand to 195.0 thousand, average hourly wages will decrease by 0.4% to 0.3% on a monthly basis and by 4.0% to 3.9% on a yearly basis, while the unemployment rate is expected to increase from 4.1% to 4.2%. On Wednesday at 15:15 (GMT 2), investors will watch the report from Automatic Data Processing (ADP) on the private sector employment rate: according to preliminary forecasts, this indicator will be revised from 233.0 thousand to 150.0 thousand.
Support and resistance levels
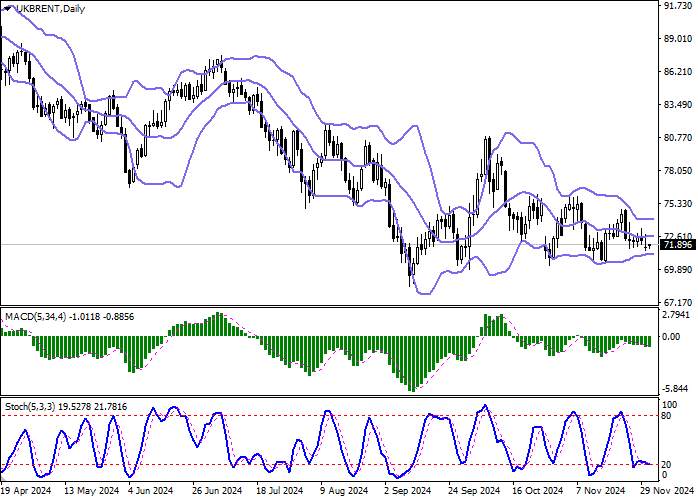
On the daily chart, Bollinger Bands are flat: the price range is almost unchanged, which is still quite wide for the current level of positive sentiment in the market. The MACD indicator is falling, maintaining a weak buy signal (the histogram is below the signal line). Stochastic, after approaching the "20" level, shows a sideways trend, which shows the mixed trading characteristics of the past few days: it is worth waiting for the signals from the indicator to be clarified.
Resistance levels: 72.00, 73.00, 74.00, 75.24.
Support levels: 71.00, 70.00, 69.00, 68.00.


Trading scenarios
It is possible to consider opening a sell order, after the price breaks below 71.00, with a take profit target at 69.00. Stop loss — 72.00. Execution time: 2–3 days.
It is possible to consider opening a buy order, after the price breaks above 73.00 with a take profit target at 75.24. Stop loss — 72.00.
风险提示:以上内容仅代表作者或嘉宾的观点,不代表 FOLLOWME 的任何观点及立场,且不代表 FOLLOWME 同意其说法或描述,也不构成任何投资建议。对于访问者根据 FOLLOWME 社区提供的信息所做出的一切行为,除非另有明确的书面承诺文件,否则本社区不承担任何形式的责任。
FOLLOWME 交易社区网址: followme.asia


加载失败()