PNC Financial Services (NYSE: PNC) is down more than 20% in the recent 4 months. Investors are looking for clues into the current decline to prepare a plan for the next move. We’ll use the Elliott Wave Theory to define the technical structure and understand the potential path.
Since December 2024 peak, PNC is showing a clear 3 swings decline and we can define it as an Elliott Wave Zigzag structure. Wave ((A)) ended in 12.20.2024 at $185, wave ((B)) ended in 1/29/2025 at $205 and the wave ((C)) remains in progress. In other words, the current move to the downside is corrective and it's still expected to end wave (5) of ((C)) at the equal legs with the Blue Box area $170.68 - $149.25.
PNC 4 Hour Elliott Wave Chart
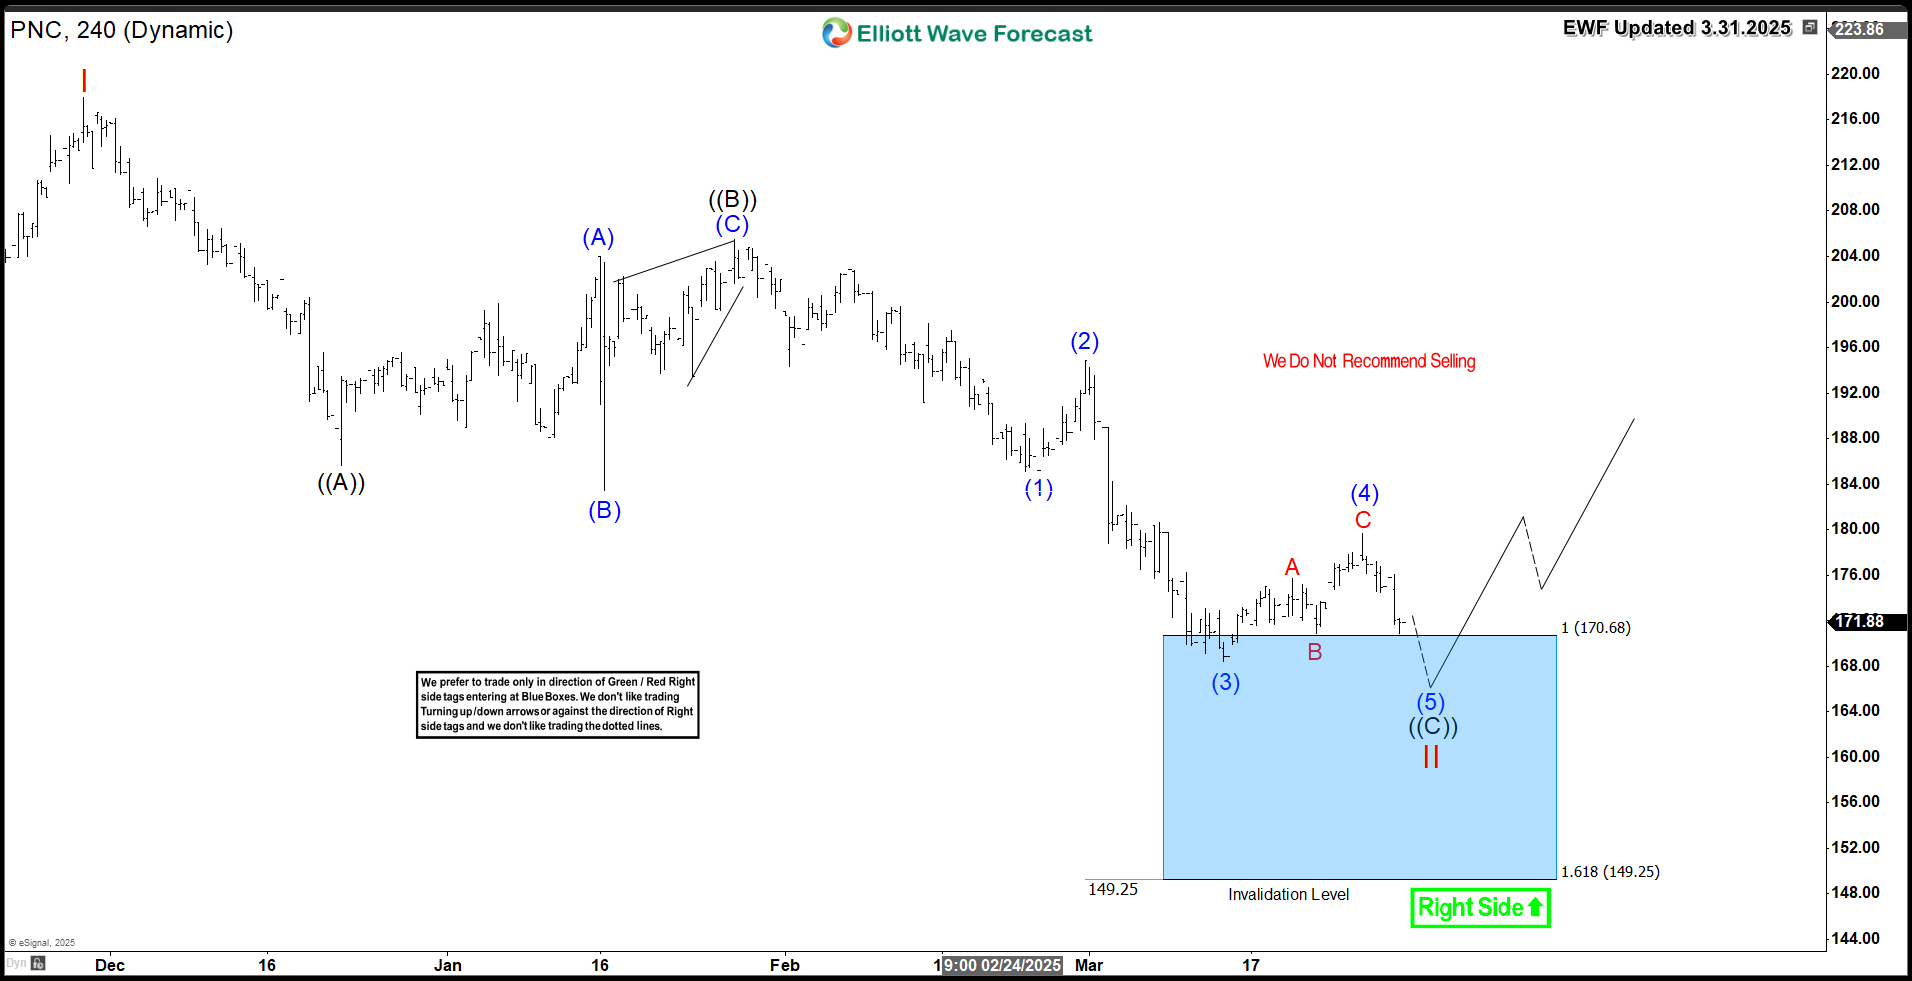
The blue box in the above charts is a High-frequency area where the market is likely to end the current cycle and make a turn. Consequently, we expect PNC to react to the upside as buyers will be looking for the trend to resume or will be looking for a 3 waves bounce at least.
In conclusion, PNC is showing a corrective decline and we only recommend buying the pullback in 3 , 7 or 11 swings as we expect a reaction higher to take place in the second quarter of this year.
风险提示:以上内容仅代表作者或嘉宾的观点,不代表 FOLLOWME 的任何观点及立场,且不代表 FOLLOWME 同意其说法或描述,也不构成任何投资建议。对于访问者根据 FOLLOWME 社区提供的信息所做出的一切行为,除非另有明确的书面承诺文件,否则本社区不承担任何形式的责任。
FOLLOWME 交易社区网址: followme.asia


加载失败()