Hello traders and welcome to a a new blog post. This post will discuss how we utilize the Elliott wave theory to spot trading opportunities from our proprietary blue box zone. In this one, the spotlight will be on AMZN stock price.
Amazon.com, Inc. is a global tech giant known for its e-commerce platform, cloud computing services (AWS), and digital innovation. Founded by Jeff Bezos in 1994, the company has grown into one of the world’s most valuable and influential corporations, trading under the ticker AMZN on the NASDAQ.
AMZN started a pullback in February 2025 to correct the bullish cycle from December 2022. Typically, such pullbacks either complete a 3, 7 or 11 swing structure. From the top of February, AMZN completed a 5-wave impulse structure which we labelled wave ((A)) for members. Thus, a 3-swing bounce should follow and another 5-wave lower to finish a bigger degree ((A))-((B))-((C)) decline that should correct the bullish cycle from December 2022. Eventually, a 3-swing bounce followed for wave ((B)) and price broke the low of ((A)) to establish ((C)). However, wave ((C)) was far from being completed. Thus, we mentioned to members to sell next bounces in 3,7 or 11 swings on the H1 till ((C)) is exhausted at the equal leg.
AMZN Elliott Wave Setup - 2nd April, 2025
Wave ((B)) breached the low of ((A)) on 18th March 2025 with a 5-wave impulse structure. We identified the low as wave (1) of ((C)). Afterwards, a corrective bounce immediately started for wave (2) of ((C)). The corrective bounce developed stronger to be a 7-swing structure. Therefore, we sent the chart below to members to sell AMZN from the blue box extreme of the corrective bounce
[caption id="attachment_958837" align="aligncenter" width="1024"]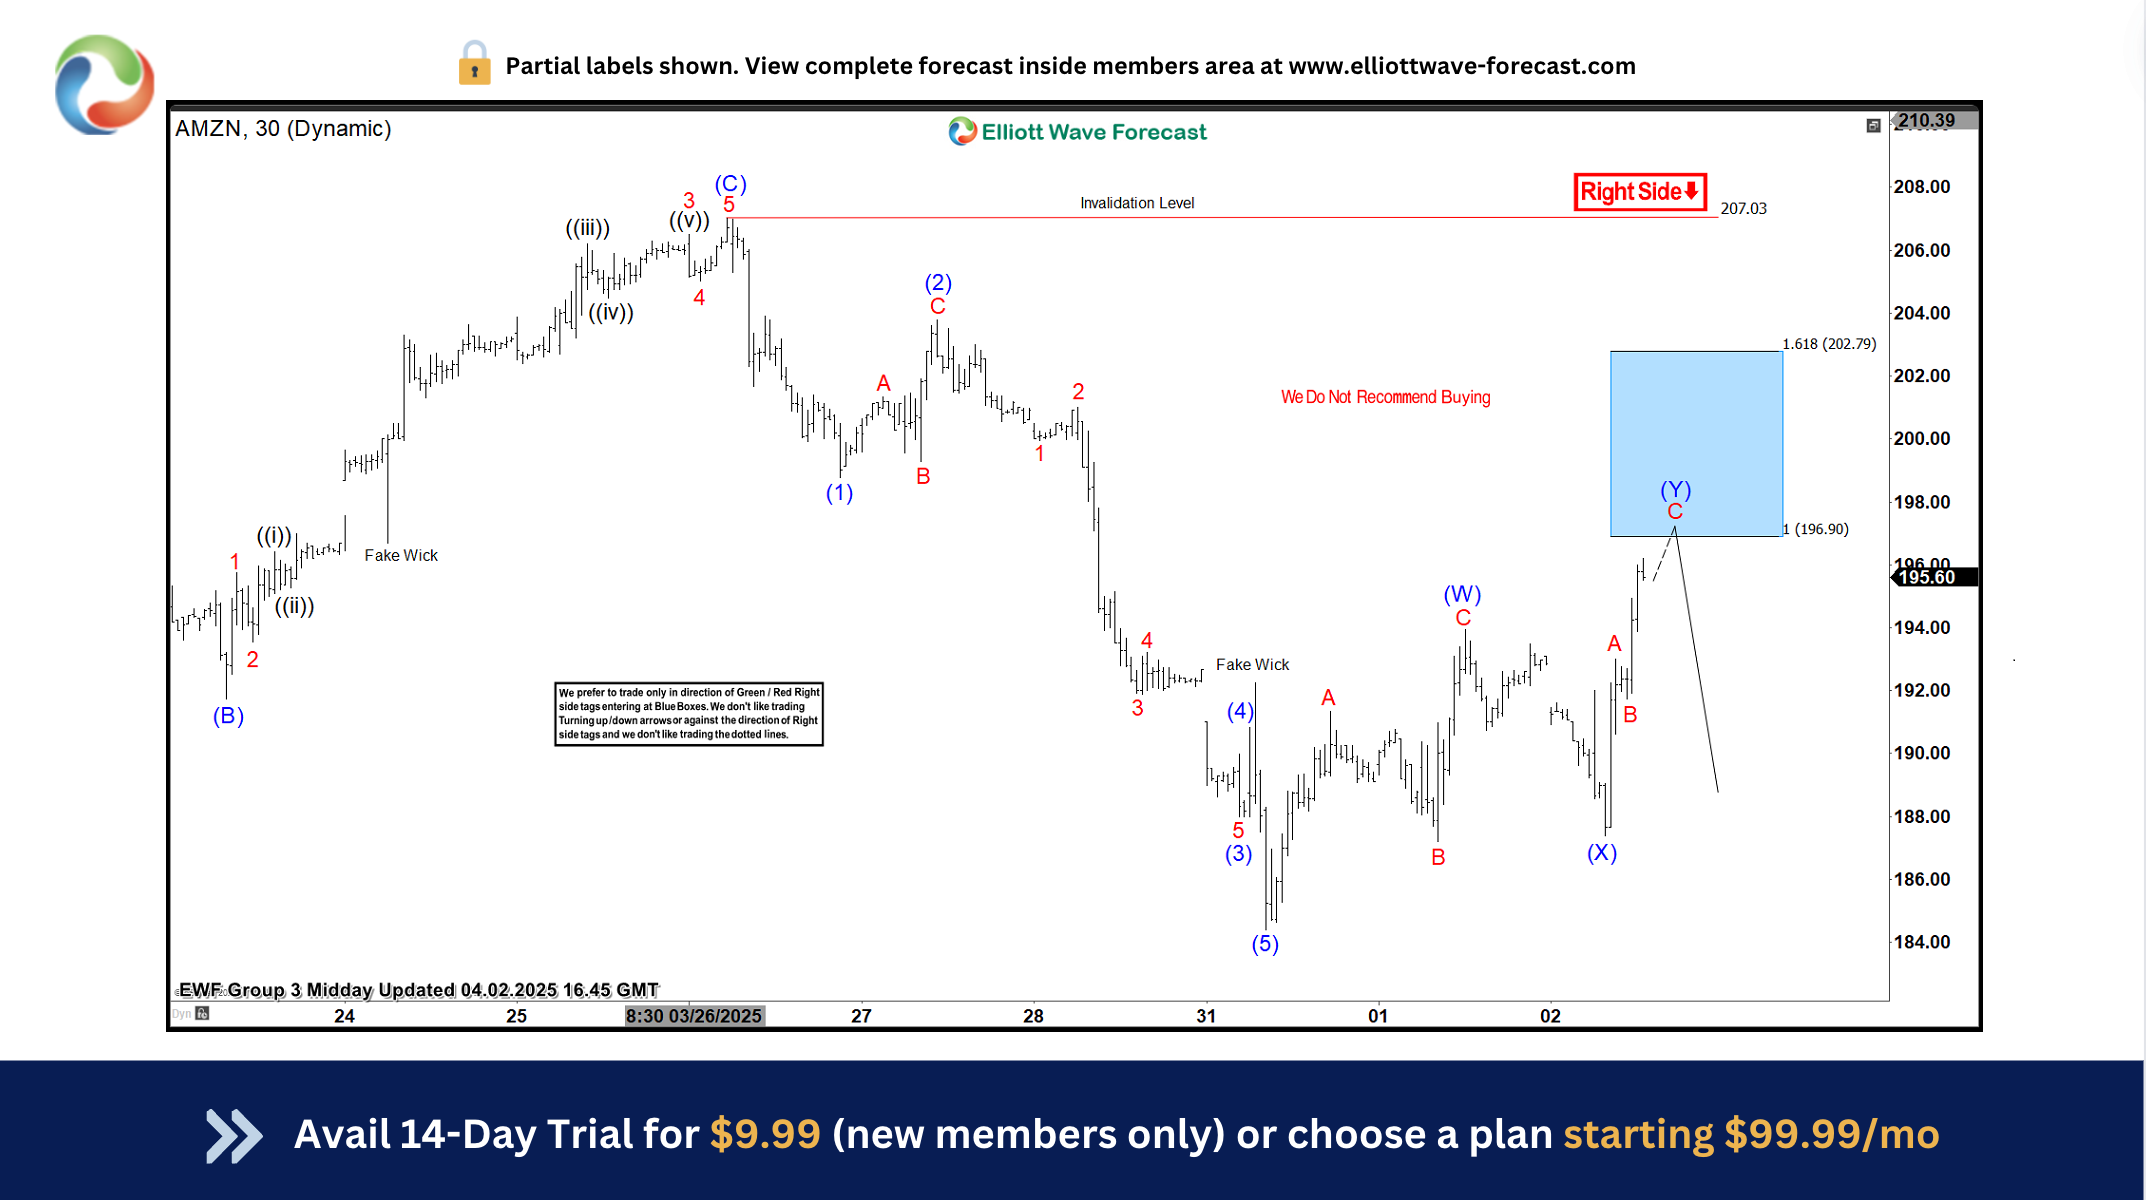 AMZN, 30 Min[/caption]
We shared the 30min chart above with the Elliottwave-forecast members identifying 196.90-202.79 as the blue box. This meant that members could sell at 196.90 and set stop at 202.79. In addition, we discussed trade management guidelines as we always like to protect profits and cut risks down to zero when the price moves in our direction.
AMZN Elliott Wave Setup - 8th April, 2025
[caption id="attachment_958838" align="aligncenter" width="1024"]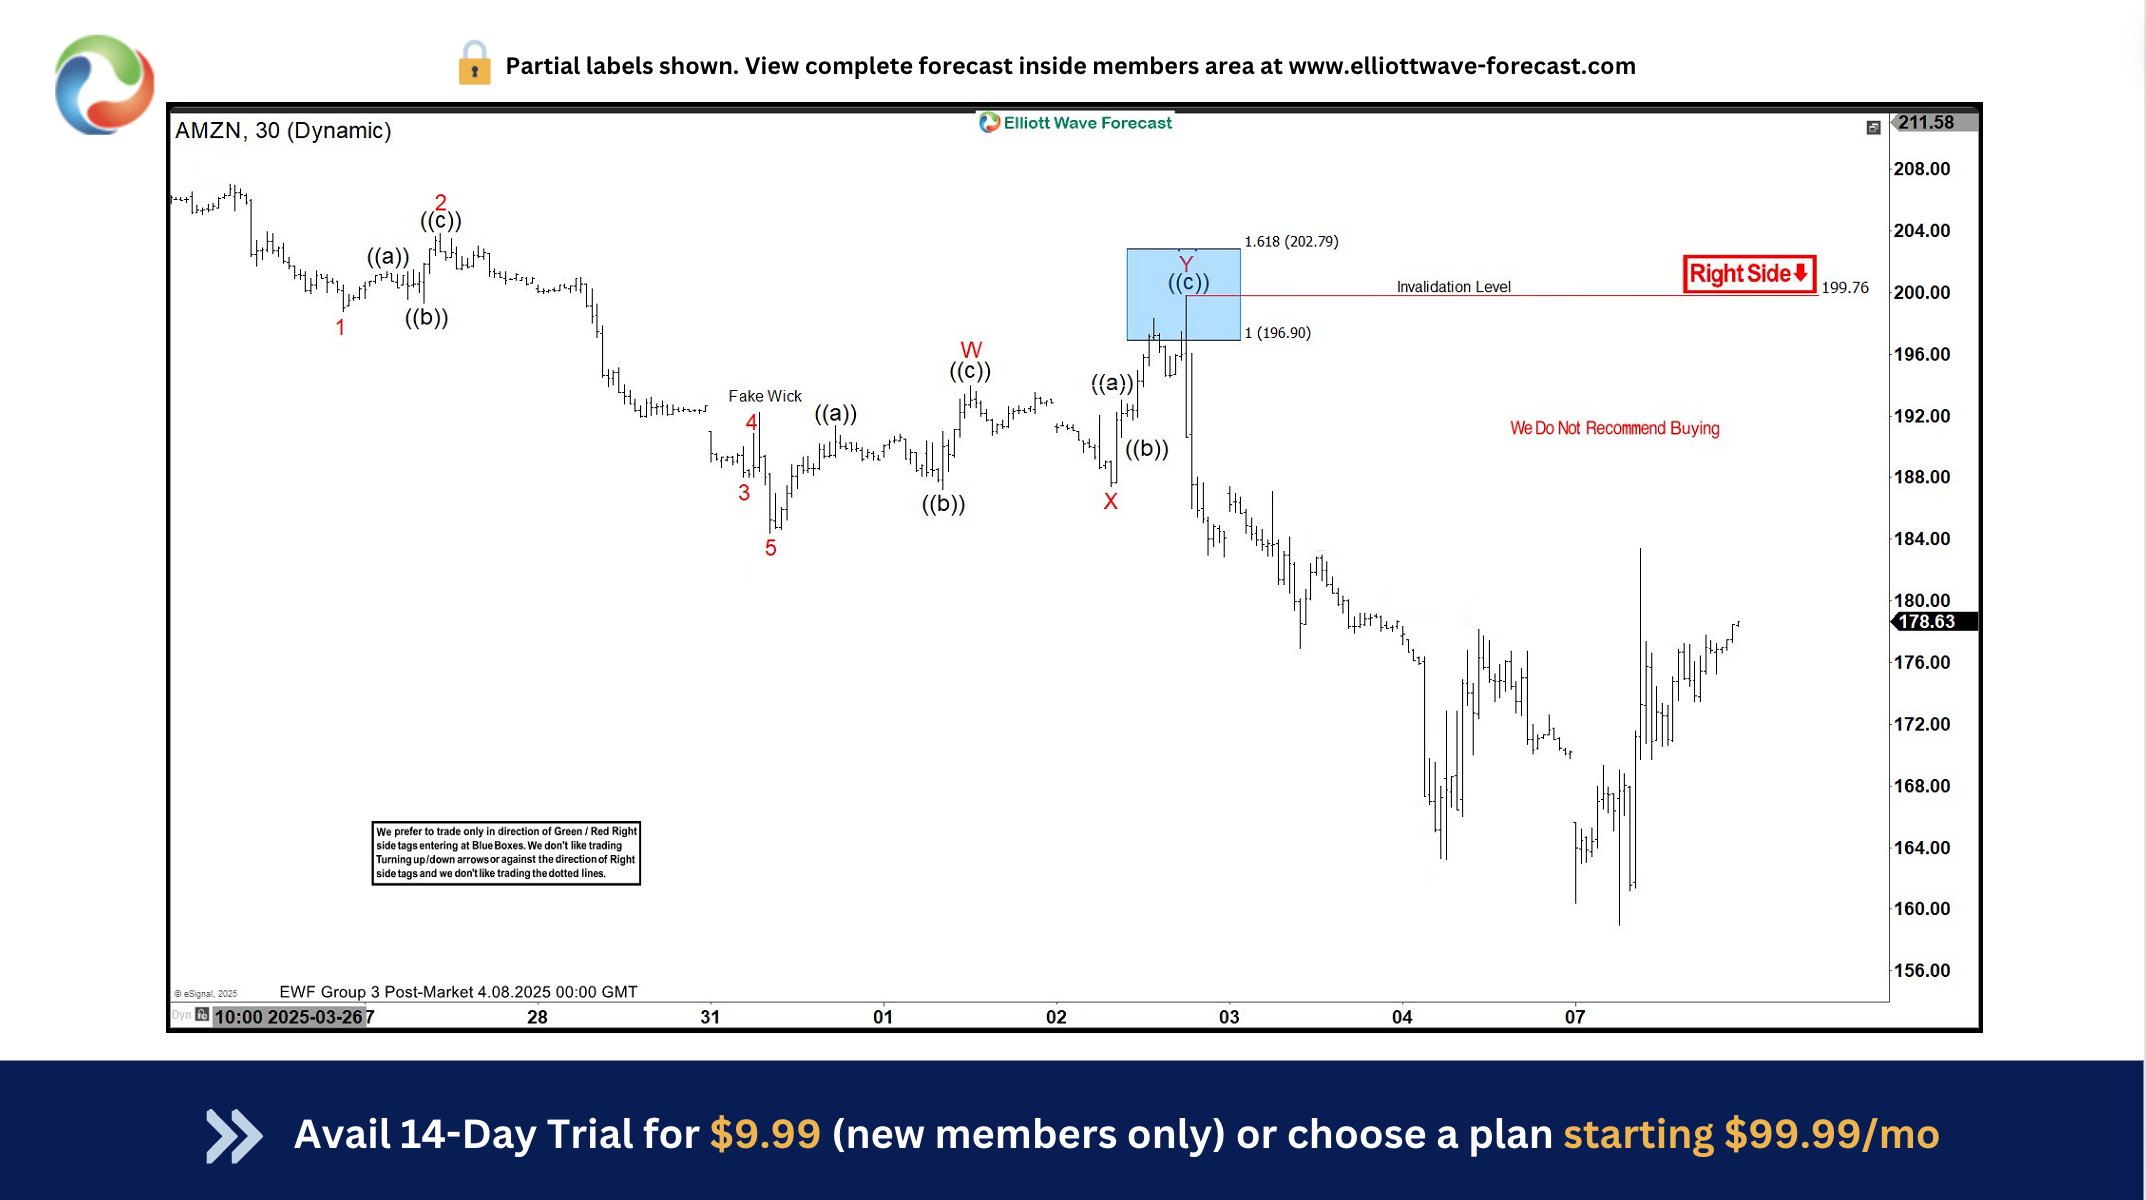 AMZN, 30 Mins[/caption]
We shared the AMZN 30 mins chart above with members on 8th April 2025. This chart shows how the stock hit the blue box to trigger a short trade. A few days later, AMZN stock plummeted by 19% to make profit for members.
AMZN Short Term Analysis - What Next?
The pullback from February 2025 high has not yet reached the extreme at $154-141. Thus it could still extend lower while price trades below $207 (26th March high). Thus, there can still be short term sell opportunities from the blue box for members targeting this extreme. Members will get more on this in the upcoming updates.
风险提示:以上内容仅代表作者或嘉宾的观点,不代表 FOLLOWME 的任何观点及立场,且不代表 FOLLOWME 同意其说法或描述,也不构成任何投资建议。对于访问者根据 FOLLOWME 社区提供的信息所做出的一切行为,除非另有明确的书面承诺文件,否则本社区不承担任何形式的责任。
FOLLOWME 交易社区网址: followme.asia


加载失败()