- NZD/USD trades near the 0.5530 zone ahead of Asia after modest intraday gains on Tuesday.
- Despite the uptick, broader signals remain bearish with price capped by multiple moving averages.
- Key resistance stands around the 0.5567–0.5674 band, with downside pressure building below the 0.5657 zone.
The NZD/USD pair registered neutral movements during Tuesday’s session, with the pair seen moving around the 0.5530 region but cleared gains which took it to highs above 0.5600.
Daily chart
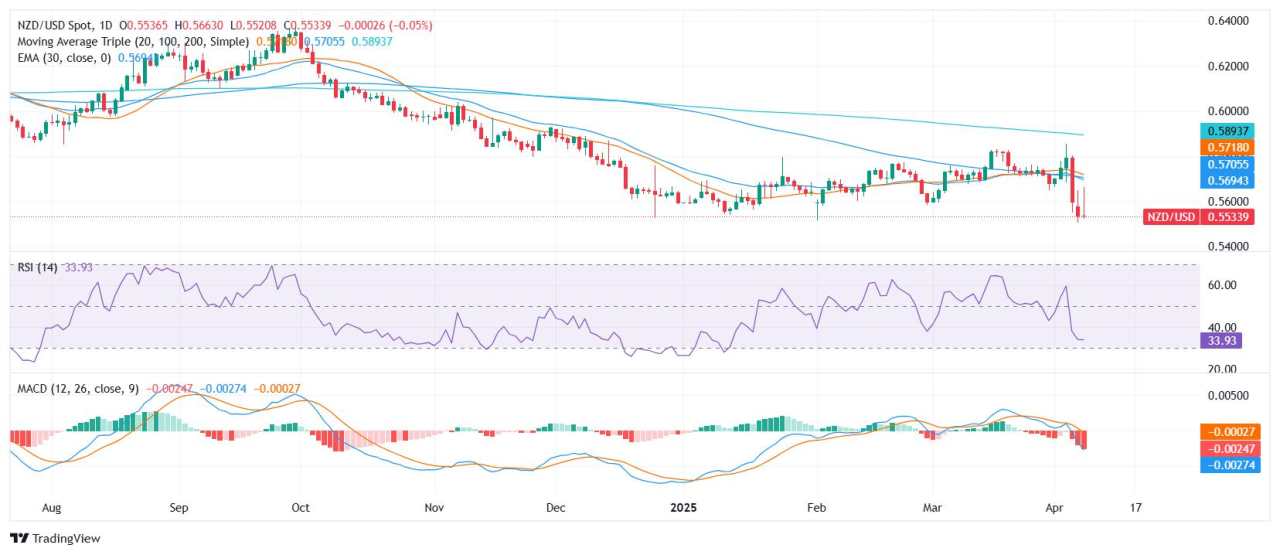
Technically, the Relative Strength Index (RSI) at 35.28, with subdued momentum but deep in negative terrain. The Moving Average Convergence Divergence (MACD) continues to flash a sell signal, reinforcing the broader downside outlook. Meanwhile, the Bull Bear Power indicator sits neutral at −0.01859, and 10-period Momentum at −0.01851 leans slightly bullish.
The bigger picture remains under pressure. The 10-day Exponential Moving Average (EMA) at 0.56571 and 10-day Simple Moving Average (SMA) at 0.56787 continue sloping downward. Additionally, the 20-day SMA (0.57184), 100-day SMA (0.57116), and 200-day SMA (0.58985) all support the bearish case, forming a zone of confluence that reinforces the pair’s inability to sustain rebounds.
作者:Patricio Martín,文章来源FXStreet,版权归原作者所有,如有侵权请联系本人删除。
风险提示:以上内容仅代表作者或嘉宾的观点,不代表 FOLLOWME 的任何观点及立场,且不代表 FOLLOWME 同意其说法或描述,也不构成任何投资建议。对于访问者根据 FOLLOWME 社区提供的信息所做出的一切行为,除非另有明确的书面承诺文件,否则本社区不承担任何形式的责任。
FOLLOWME 交易社区网址: followme.asia


加载失败()