- AUD/JPY surged, seen trading near the 91.00 zone after a strong intraday rally
- Despite the bullish move, key indicators still suggest an overall bearish technical backdrop
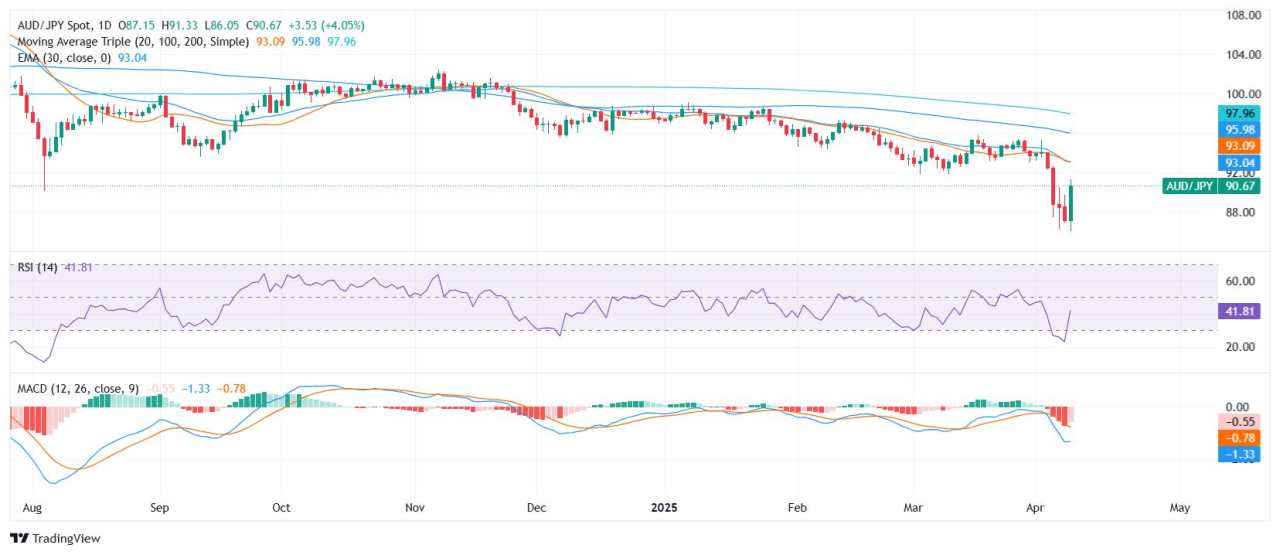
- Short-term resistance is seen near 91.20 and 91.90, with support holding around 90.90 and 87.30
The AUD/JPY pair staged a sharp rebound on Wednesday’s session ahead of the Asian open, climbing toward the 91.00 area after rising more than 4% during the day. Despite the aggressive intraday bounce, technical indicators and moving averages continue to flash bearish signals, hinting at lingering downside risk even as short-term momentum turns positive.
The pair is currently trading near the upper boundary of the day’s range, which spanned from 86.05 to 91.27, suggesting strong bullish pressure. However, several technical readings temper the optimism. The Relative Strength Index (RSI) stands at 42.71, still within neutral territory, while the Moving Average Convergence Divergence (MACD) issues a sell signal. Stochastic %K (14, 3, 3) at 29.69 and the Ultimate Oscillator at 48.82 both reflect neutral momentum.
Moving averages reinforce the broader bearish narrative. The 20-day Simple Moving Average (SMA) at 93.11, 100-day SMA at 96.08, and 200-day SMA at 98.08 all slope downward. Additionally, the 10-day Exponential Moving Average (EMA) at 91.19 and the 10-day SMA at 91.89 are positioned above current price levels, acting as immediate resistance zones.
Daily chart
作者:Patricio Martín,文章来源FXStreet,版权归原作者所有,如有侵权请联系本人删除。
风险提示:以上内容仅代表作者或嘉宾的观点,不代表 FOLLOWME 的任何观点及立场,且不代表 FOLLOWME 同意其说法或描述,也不构成任何投资建议。对于访问者根据 FOLLOWME 社区提供的信息所做出的一切行为,除非另有明确的书面承诺文件,否则本社区不承担任何形式的责任。
FOLLOWME 交易社区网址: followme.asia


加载失败()