Safe-haven assets caught a strong bid in recent trading, directing Spot Gold to all-time highs of US$3,220/troy ounce versus the US dollar (XAU/USD). The shift towards safe-haven markets was fuelled by softer demand for the USD as markets fled dollar assets, as well as escalating trade tensions between the US and China. Unsurprisingly, the Swiss franc (CHF) and Japanese yen (JPY) also attracted substantial bids, with the USD/CHF pair notching up losses of nearly 4.0% – its largest one-day drop since 2015!
Monthly resistance and oversold conditions
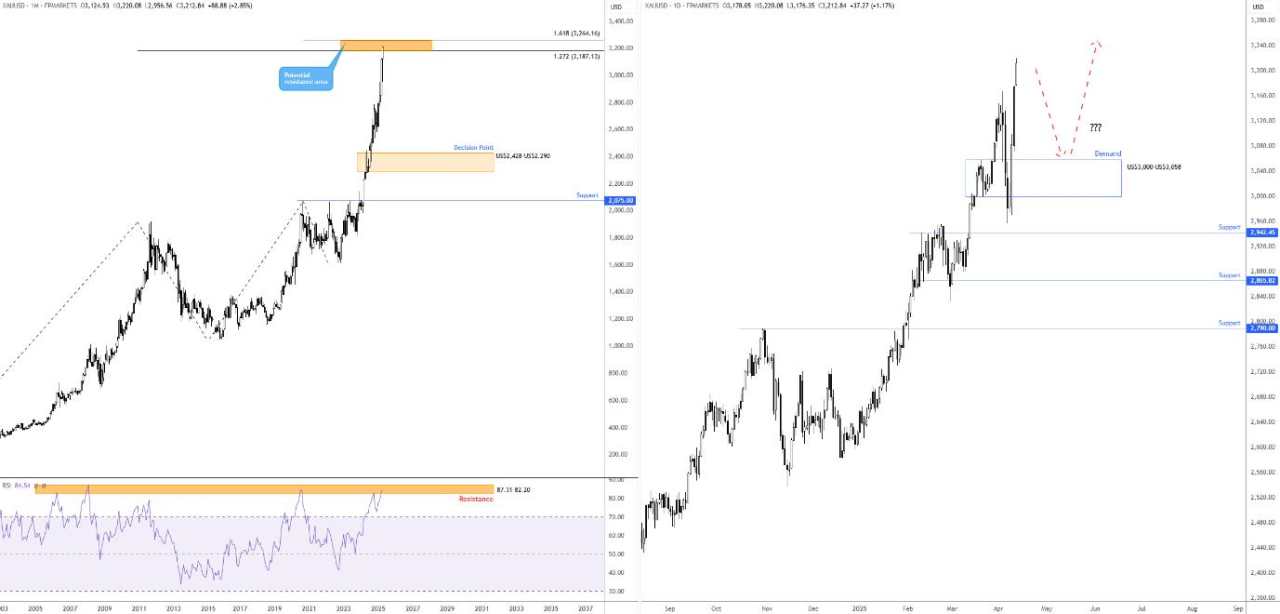
Several desks are reportedly eyeing US$3,500 as the next upside objective for Gold; however, the monthly chart reveals it is considerably overbought according to the Relative Strength Index (RSI). You will note the RSI has remained within overbought territory since mid-2024 and recently touched gloves with familiar resistance between 87.31 and 82.20. This area boasts historical significance from as far back as 2006, and each time the Index has approached the resistance, a correction/pause typically followed in the yellow metal. Consequently, it raises the question about whether buying is set to moderate/pause at the monthly resistance area between US$3,264 and US$3,187 (made up of 1.618% and 1.272% Fibonacci projection ratios, respectively)?
Daily demand zone, dip-buying?
Meanwhile, on the daily chart, price action came within a stone’s throw of testing support from US$2,942 at the beginning of the week before rallying to all-time highs noted above. What is interesting from a technical perspective is that the move left behind a demand area at US$3,000-US$3,058, which, in my opinion, represents a key technical zone.
With Gold firmly entrenched in a strong uptrend, dip-buyers could emerge from the daily demand area if a correction occurs. That said, given technical indicators on the monthly chart suggesting buyers could pump the brakes, any dip-buying activity would likely be approached with caution. Confirmation – such as a bullish candlestick signal or supporting price action on lower time frames – might be required before pulling the trigger. However, any movement below the mentioned demand area signals bearish strength from the monthly resistance zone, and potentially opens the door to short-term selling opportunities, targeting daily support at US$2,942, closely followed by support at US$2,865, and possibly US$2,790.
Charts created using TradingView
作者:Aaron Hill,文章来源FXStreet,版权归原作者所有,如有侵权请联系本人删除。
风险提示:以上内容仅代表作者或嘉宾的观点,不代表 FOLLOWME 的任何观点及立场,且不代表 FOLLOWME 同意其说法或描述,也不构成任何投资建议。对于访问者根据 FOLLOWME 社区提供的信息所做出的一切行为,除非另有明确的书面承诺文件,否则本社区不承担任何形式的责任。
FOLLOWME 交易社区网址: followme.asia


加载失败()