Candle sizes (not option prices)
Bear markets are more volatile than bull markets. While that is easy to understand, oftentimes traders and investors overlook its simple application when it comes to calling bottoms or tops of trends. The idea is that if you could tell the bear market was ending anywhere around November of 2002, March of 2008, April of 2020 or even October of 2022, you’d have a generational buying opportunity on your hands.
It is a good bit more difficult than that. Other factors such as position size and opportunity cost weight heavily on hour choices. However, noticing a change in the size of candles–the difference between the highs and the lows of the day–could greatly help an investor feel more confident about their chances. The chart below gives four such examples of this phenomenon.

The candles are noticeably smaller as the market is rising, but once the candle range gets larger, the prices begin trending lower. Is the current market environment beginning to calm down enough to help investors consider jumping back in or is this a lull in the volatility storm?
Bad news just beginning?
The x-factor right now is earnings season. It opened last Friday with positive top line and bottom line news from J.P. Morgan Chase (JPM) and at least a bottom line beat from Wells Fargo Corp. (WFC), reassuring the markets that, yes, banking remains a profitable business thank you. The follow up came Tuesday as Citigroup (C ) and Bank of America (BAC).
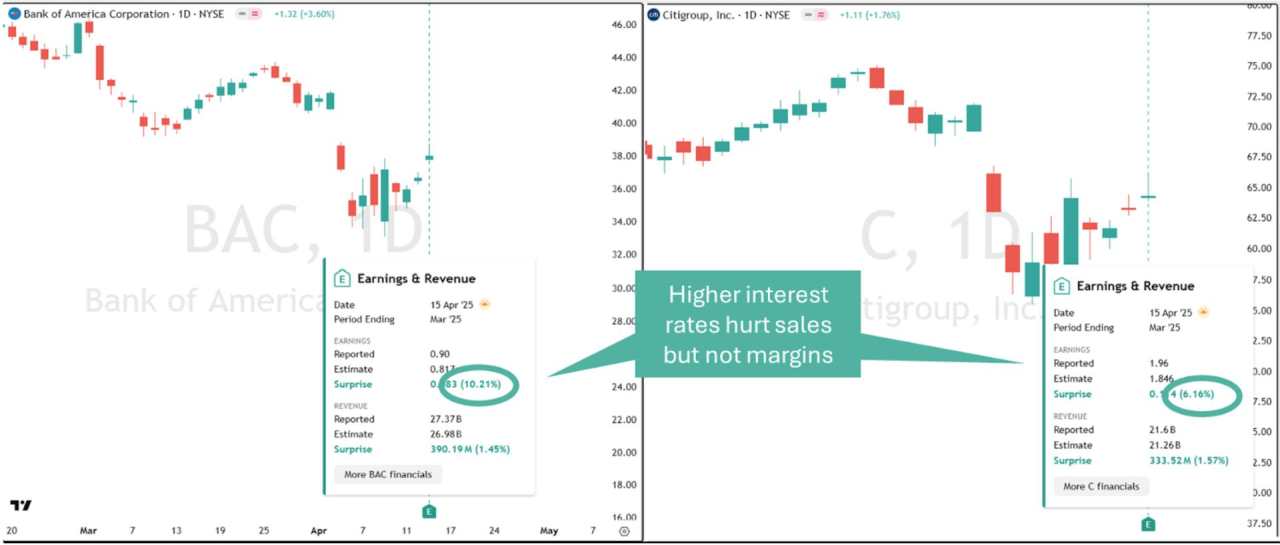
The interesting part here is that all five of the major banking stocks showed increased profits on lesser top line performance, suggesting that they have increased margins. Some of them have attributed this to the increase of revenue from trading commissions and market making, but the prolonged higher interest rates for loans hasn’t hurt anything either.
What that means, however, is that the banker’s successes aren’t driven by economic good news. In fact, looking deeper, their squeezed top lines probably imply economic weakness right now. This implies analysts will have to look later in the earnings cycle for news from companies with a more general reach into the economy. They won’t have to wait long–Netflix (NFLX) reports on Thursday. That earnings report could be a bit of a harbinger for things to come in subsequent earnings calls this season.
Gold flips the script
Perhaps the most interesting volatility dynamic occurred during the 2008 bear market. The failure of Lehman Brothers certainly increased volatility, but it did not mark the low for that bear market. Even though price volatility (as measured by the Average True Range (ATR), began to decline markedly in November of that year, it wasn’t until March when prices made their final nadir.
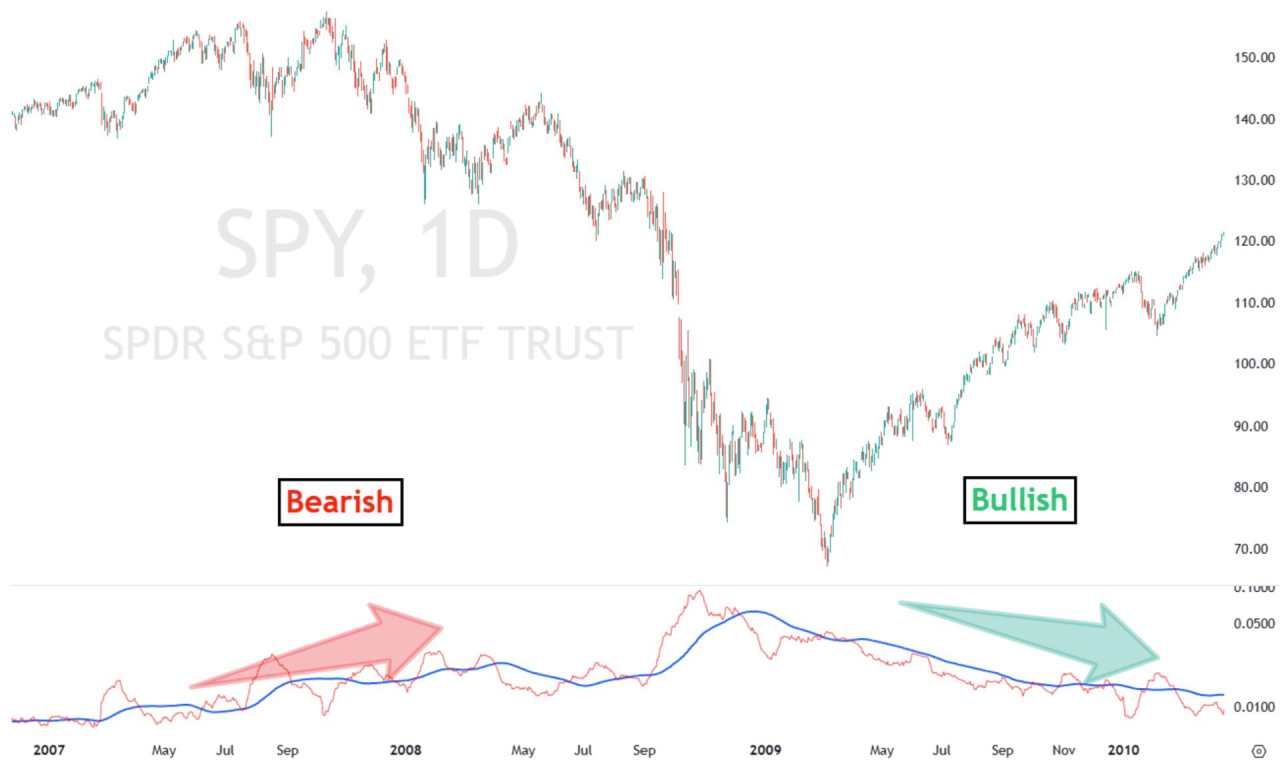
Prices fell an astonishing 32% from the November highs with price volatility declining all the while. (Take note that the chart shows the ATR in the pane below as a percentage of the price, not an absolute measure of the price itself. I chose this to avoid the appearance of a false decline in volatility). The key takeaway is that even if volatility has subsided, the markets may not have struck their local minimum just yet. Trade with caution so you can maximize your opportunity when the time comes.
Unlock exclusive gold and silver trading signals and updates that most investors don’t see. Join our free newsletter now!
作者:CMT Association Research Team,文章来源FXStreet,版权归原作者所有,如有侵权请联系本人删除。
风险提示:以上内容仅代表作者或嘉宾的观点,不代表 FOLLOWME 的任何观点及立场,且不代表 FOLLOWME 同意其说法或描述,也不构成任何投资建议。对于访问者根据 FOLLOWME 社区提供的信息所做出的一切行为,除非另有明确的书面承诺文件,否则本社区不承担任何形式的责任。
FOLLOWME 交易社区网址: followme.asia


加载失败()