- AUD/NZD trades near the 1.0700 area, retreating from intraday highs ahead of the Asian session.
- Overall bearish sentiment persists despite neutral oscillators, with all key moving averages pointing to downside pressure.
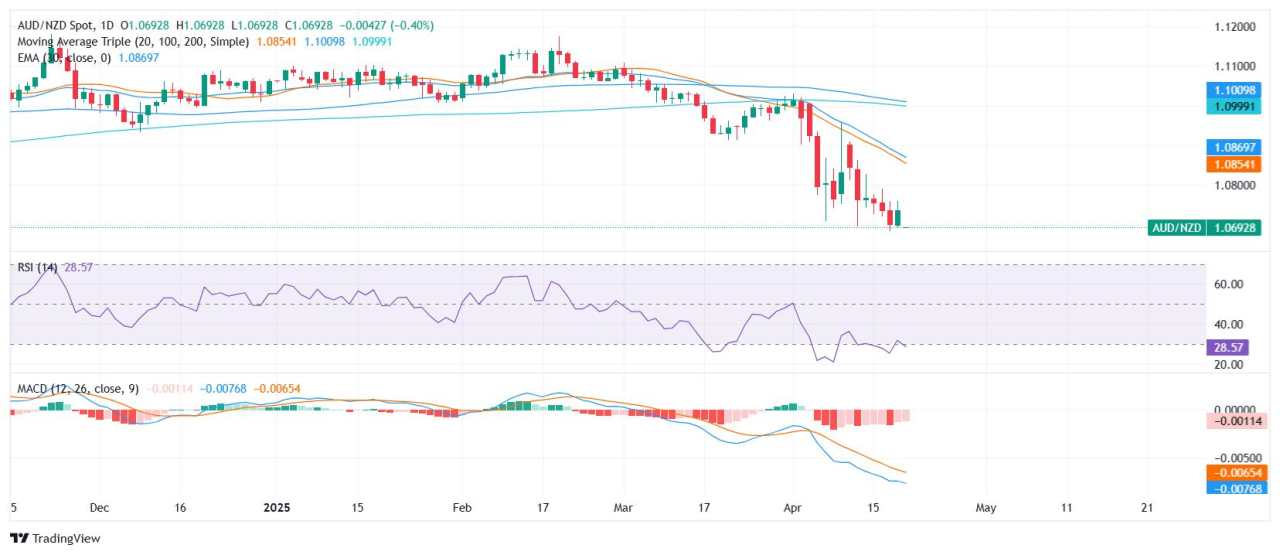
- Support lies at 1.06949, while resistance levels are seen at 1.07691, 1.07711, and 1.08238.
The AUD/NZD pair is exhibiting bearish signals, currently trading around 1.0700, down 0.40% today, and positioned mid-range between 1.06784 and 1.07439 during Monday’s session. The pair's inability to hold higher ground underlines the weight of selling pressure as the broader trend continues to favor the downside.
Momentum indicators provide mixed but cautious readings. The Relative Strength Index (RSI) stands at 31, close to oversold territory yet still holding a neutral bias. The Moving Average Convergence Divergence (MACD) continues to flash a sell signal, in alignment with the Awesome Oscillator at -0.0185, which also suggests downside continuation. Meanwhile, the Stochastic %K at 9.2611 remains neutral, lacking clear directional conviction.
The moving averages confirm the bearish technical structure. All key SMAs — 20-day at 1.0859, 100-day at 1.1010, and 200-day at 1.1000 — are sloping downward, along with shorter-term indicators like the 10-day EMA at 1.0769 and 10-day SMA at 1.0771, which further validate the dominant bearish bias.
Support is found at 1.06949. Resistance is capped at 1.07691, followed by 1.07711 and 1.08238. If selling continues and the pair slips below the 1.0690 zone, a fresh wave of downside could be triggered.
Daily chart
作者:Patricio Martín,文章来源FXStreet_id,版权归原作者所有,如有侵权请联系本人删除。
风险提示:以上内容仅代表作者或嘉宾的观点,不代表 FOLLOWME 的任何观点及立场,且不代表 FOLLOWME 同意其说法或描述,也不构成任何投资建议。对于访问者根据 FOLLOWME 社区提供的信息所做出的一切行为,除非另有明确的书面承诺文件,否则本社区不承担任何形式的责任。
FOLLOWME 交易社区网址: followme.asia


加载失败()