- EUR/GBP trades near the 0.8600 zone, easing slightly after the European session.
- Despite today's dip, the broader structure remains bullish with supportive moving averages.
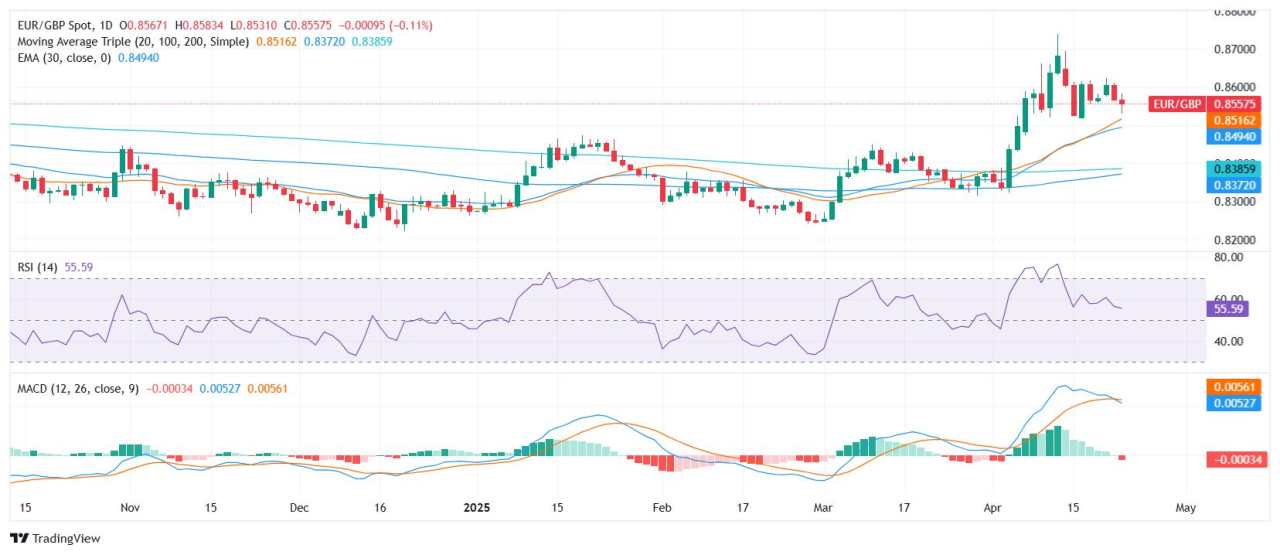
- Support is seen at 0.8550 and 0.8526, while resistance lies at 0.8564 and 0.8591.
The EURGBP pair eased slightly on Wednesday, slipping toward the lower end of its recent consolidation range after the European session. The pair was last seen hovering near the 0.8600 area, reflecting a mild pullback within a still-bullish technical setup.
Momentum indicators are offering mixed cues. The Relative Strength Index stands around 55, indicating a neutral tone, while the MACD is currently printing a sell signal. The Ultimate Oscillator and Average Directional Index also remain in neutral territory, suggesting a lack of clear short-term directional conviction.
Despite this, the broader bias remains constructive. The 20-day simple moving average at 0.8516, along with the 100-day at 0.8372 and 200-day at 0.8387, all point upward. These longer-term signals are reinforced by bullish inputs from the 30-day exponential moving average at 0.8493 and the 30-day SMA at 0.8470.
Key support levels are located at 0.8550, 0.8527, and 0.8526. On the upside, immediate resistance is found at 0.8564, with additional barriers at 0.8569 and 0.8591. For now, the pair remains range-bound but retains a bullish tilt as long as it holds above the 0.8500 handle.
EUR/GBP Daily chart
作者:Patricio Martín,文章来源FXStreet,版权归原作者所有,如有侵权请联系本人删除。
风险提示:以上内容仅代表作者或嘉宾的观点,不代表 FOLLOWME 的任何观点及立场,且不代表 FOLLOWME 同意其说法或描述,也不构成任何投资建议。对于访问者根据 FOLLOWME 社区提供的信息所做出的一切行为,除非另有明确的书面承诺文件,否则本社区不承担任何形式的责任。
FOLLOWME 交易社区网址: followme.asia


加载失败()