USD: Jun '25 is Down at 99.110.
Energies: Jun '25 Crude is Up at 63.06.
Financials: The Jun '25 30 Year T-Bond is Higher by over 13 ticks and trading at 114.18.
Indices: The Jun '25 S&P 500 emini ES contract is 30 ticks Lower and trading at 5396.00.
Gold: The Jun'25 Gold contract is trading Up at 3345.40.
Initial conclusion
This is not a correlated market. The USD is Down and Crude is Up which is not normal, but the 30 Year T-Bond is trading Higher. The Financials should always correlate with the US dollar such that if the dollar is Higher, then the bonds should follow and vice-versa. The S&P is Lower and Crude is trading Higher which is correlated. Gold is trading Higher which is correlated with the US dollar trading Down. I tend to believe that Gold has an inverse relationship with the US Dollar as when the US Dollar is down, Gold tends to rise in value and vice-versa. Think of it as a seesaw, when one is up the other should be down. I point this out to you to make you aware that when we don't have a correlated market, it means something is wrong. As traders you need to be aware of this and proceed with your eyes wide open. Asia traded Higher with the exception of the Shanghai exchange. All of Europe is trading Lower with the exception of the Milan exchange which is Higher.
Possible challenges to traders
- Unemployment Claims are out at 8:30 AM EST. This is Major.
- Durable Goods are out at 8:30 AM EST. This is Major.
- Core Durable Goods are out at 8:30 AM EST. This is Major.
- Existing Home Sales are out at 10 AM EST. This is Major.
- Natural Gas Storage is out at 10:30 AM EST. This is Major.
Traders, please note that we've changed the Bond instrument from the 10 Year (ZN) to the 2 Year (ZT). They work exactly the same.
We've elected to switch gears a bit and show correlation between the 2-year Treasury notes (ZT) and the S&P futures contract. The YM contract is the Dow Jones Industrial Average, and the purpose is to show reverse correlation between the two instruments. Remember it's likened to a seesaw, when up goes up the other should go down and vice versa.
Yesterday the ZT fell Lower at around 8:30 AM EST with Unemployment Claims pending. The Dow climbed Higher at the same time. Look at the charts below and you'll see a pattern for both assets. The Dow moved Higher at 8:30 AM EST and the ZT moved Lower at around the same time. These charts represent the newest version of Bar Charts, and I've changed the timeframe to a 15-minute chart to display better. This represented a Short opportunity on the 2-year note, as a trader you could have netted 30 plus ticks per contract on this trade. Each tick is worth $6.25. Please note: the front month for ZT is now Jun '25 and the Dow is Jun '25 as well. I've changed the format to filled Candlesticks (not hollow) such that it may be more apparent and visible.
Charts courtesy of barcharts
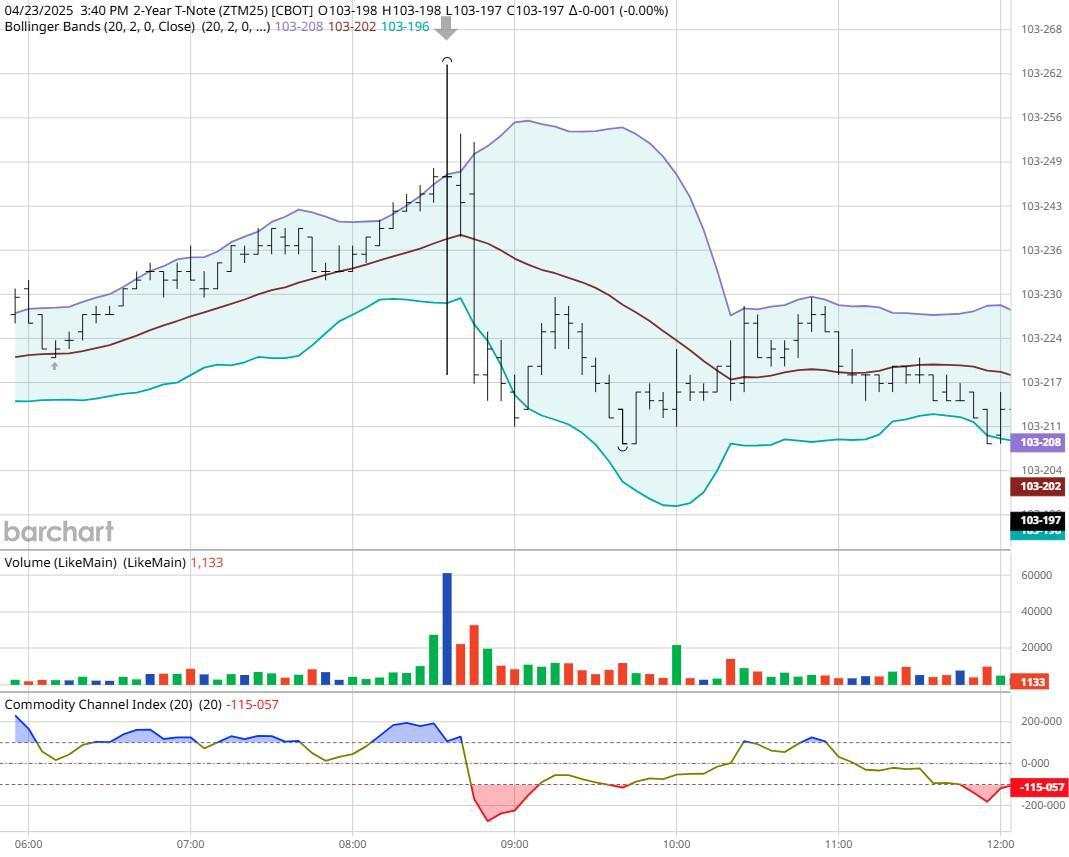
ZT -Jun 2025 - 4/23/25
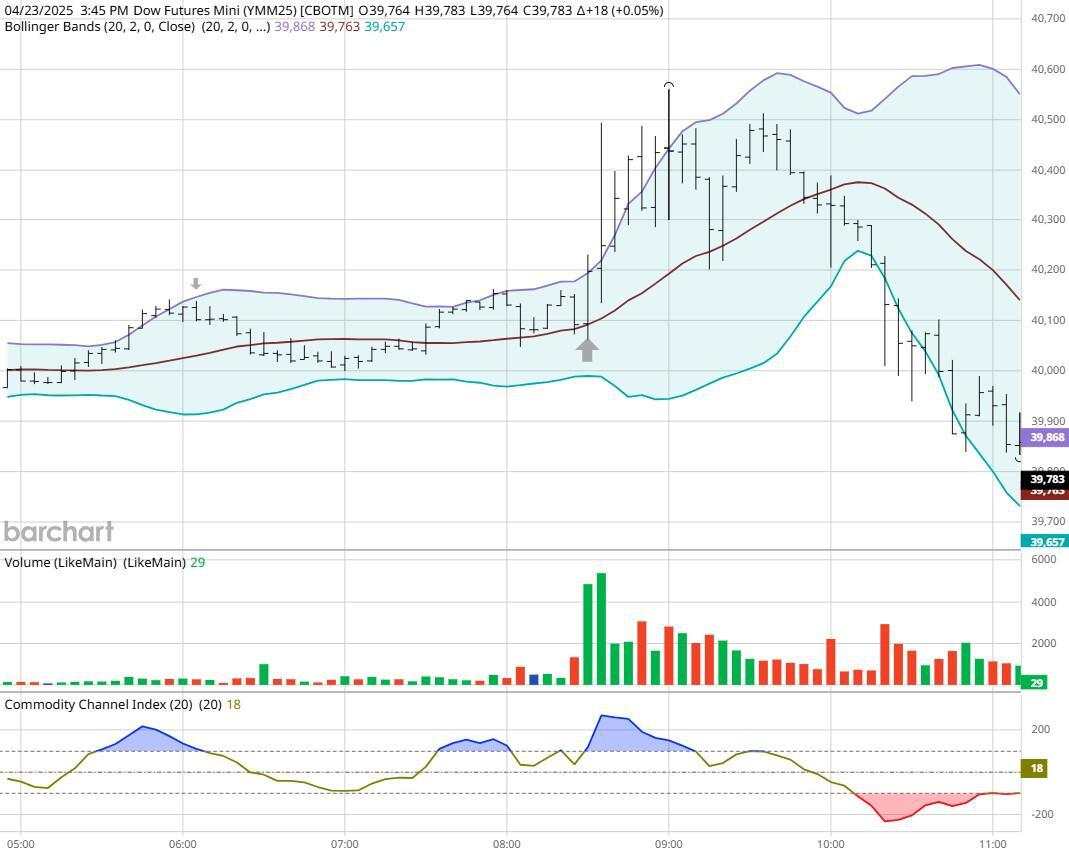
Dow - Mar 2025- 4/23/25
Bias
Yesterday we gave the markets an Upside bias, and the indices didn't disappoint. The Dow gained 420 points on the session and the other indices climbed Higher as well. Today we aren't dealing with a correlated market, and our bias is to the Downside.
Could this change? Of Course. Remember anything can happen in a volatile market.
Commentary
It seemed that President Trump backed off on his comment to fire Fed Chair Powell and the markets reacted favorably to this news. Truth be told the President can't fire the Fed Chair as the Federal Reserve reports to Congress, not the President and to do so would be illegal. He could fire him for dishonest conduct but knowing Powell's record that would be far fletched at best.
作者:Nick Mastrandrea,文章来源FXStreet,版权归原作者所有,如有侵权请联系本人删除。
风险提示:以上内容仅代表作者或嘉宾的观点,不代表 FOLLOWME 的任何观点及立场,且不代表 FOLLOWME 同意其说法或描述,也不构成任何投资建议。对于访问者根据 FOLLOWME 社区提供的信息所做出的一切行为,除非另有明确的书面承诺文件,否则本社区不承担任何形式的责任。
FOLLOWME 交易社区网址: followme.asia


加载失败()