#candlestick#
1.57k 浏览
192 讨论
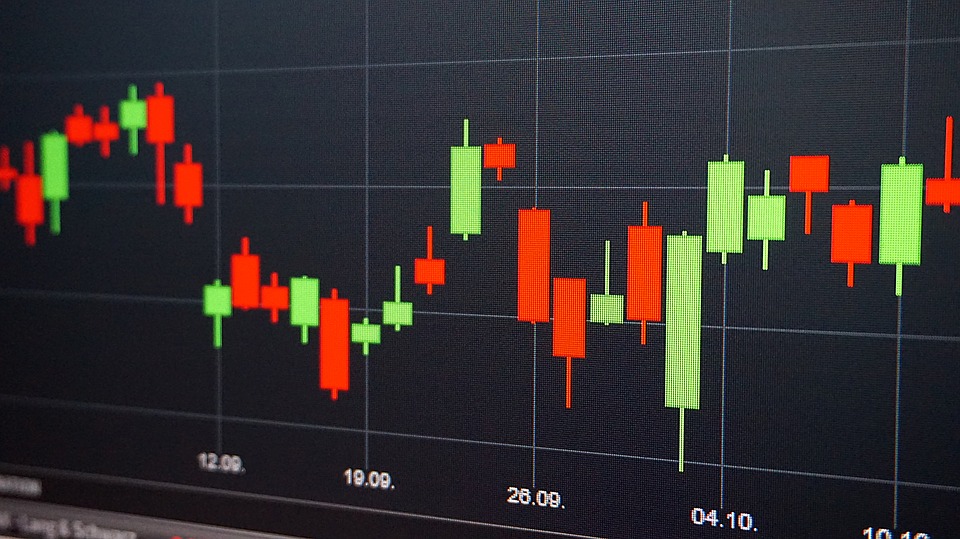
A candlestick chart (also called Japanese candlestick chart) is a style of financial chart used to describe price movements of a security, derivative, or currency. Each "candlestick" typically shows one day, thus a one-month chart may show the 20 trading days as 20 candlesticks. Candlestick charts can also be built using intervals shorter or longer than one day.
分享你的交易经验吧!


- FOLLOWME Support :Weibo has obtained the basic prize in the Opinion Leader Program: 20 FOCIN that can withdraw. Click to know more details about //socia...


上拉加载
